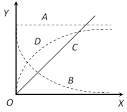
JEE Main & Advanced Physics Nuclear Physics And Radioactivity Question Bank Graphical Questions

  • question_answer
    In Fig. X represents time and Y represent activity of a radioactive sample. Then the activity of sample, varies with time according to the curve

    A)            A

    B)            B

    C)            C

    D)            D

    Correct Answer: B

    Solution :

                       Activity \[=-\frac{dN}{dt}=\lambda N=\lambda \ {{N}_{0}}{{e}^{-\lambda t}}\] i.e., graph between activity and t, be exponential having negative slope.


You need to login to perform this action.
You will be redirected in 3 sec spinner