| Read the following pie-chart carefully and answer the questions asked. |
 |
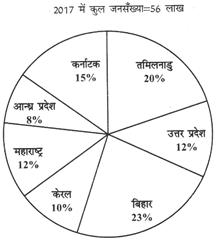 |
| What is the respective ratio of population of Tamil Nadu in 2016 to that of 2017? |
A) \[8:13\]
B) \[17:29\]
C) \[15:28\]
D) \[15:31\]
E) None of these
Correct Answer: C


You need to login to perform this action.
You will be redirected in
3 sec

