| Study the following graph carefully and answer the questions given below it. |
| Profit percent earned by two companies in various years. Profit percent of two companies in various years |
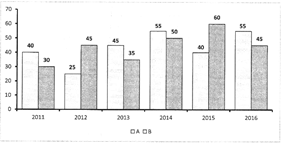 |
| In which of the following years was there maximum percentage of growth/decline with respect to the previous year in case of company A? |
A) Years 2012
B) Years 2015
C) Years 2011
D) Years 2016
E) Can not be determined
Correct Answer: E


You need to login to perform this action.
You will be redirected in
3 sec

