| Study the following bar graph and answer the given questions. |
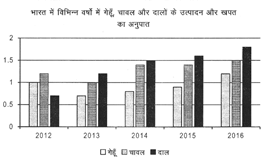 |
| If in the year 2012 the production of pulses is 21 ton and consumption of rice is 20 ton. How much % the consumption of pulses in 2012 is more/less than production of rice in same year. |
A) 24%
B) 25%
C) 45%
D) 60%
E) 55%
Correct Answer: B


You need to login to perform this action.
You will be redirected in
3 sec

