| The following Line chart gives the ratio of the amounts of imports by a Company to the amount of exports from that Company over the period from 2011 to 2017. Answer the following questions based on following Line graph. Ratio of value of imports to export |
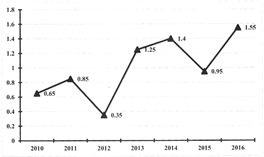 |
| What was the percentage increase in imports from 2013 to 2014? |
A) 70
B) 72
C) 74
D) Data Inadequate
E) None of these
Correct Answer: D


You need to login to perform this action.
You will be redirected in
3 sec

