| Study the following information carefully and answer the given questions. |
| The following bar graph shows the selling price of an article (In Rs.) and the profit % earned by selling the article. |
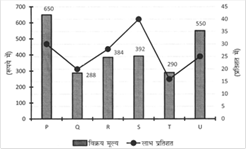 |
| Find the average cost price of the article P, Q, R and S together. |
|
A) Rs. 250 B) Rs. 350 |
|
C) Rs. 300 D) Rs. 330 |
|
E) None of these |
Correct Answer: D


You need to login to perform this action.
You will be redirected in
3 sec

