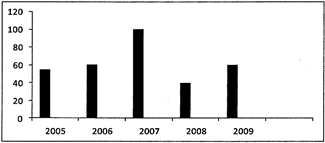
| Directions : The following bar graph shows the production of food grains in an Indian state during the five consecutive years. |
 |
A) 2005
B) 2006
C) 2007
D) 2008
Correct Answer: C
Solution :
(c): Production is rising from 2005 to 2007 but after 2007, it drops to 40 units.


You need to login to perform this action.
You will be redirected in
3 sec

