Directions: The bar graph provided below represents the production of Rice and Wheat in different states of a country in the certain year. Answer questions based on the bar graph. 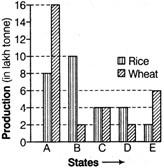 |
A) B
B) C
C) D
D) E
Correct Answer: C
Solution :
| [c] Total production of Rice and Wheat in state B \[=10+2=12\]lakh tonne in state C \[=4+4=8\]lakh tonne in state D \[=4+2=6\]lakh tonne in state E \[=2+6=8\]lakh tonne Thus, production is minimum in state D. |


You need to login to perform this action.
You will be redirected in
3 sec

