| Read the following and answer any four questions from [11] to [15]. | ||||||||||||||||
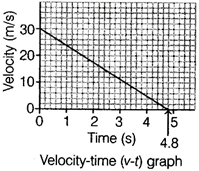
| A car was travelling at 30 m/s. The driver applies brakes suddenly by seeing a running dog. The velocity-time (v-t) graph and its corresponding table during the time of applying brakes is shown below. | ||||||||||||||||
| Velocity-time graph shows how the velocity of a body changes with passage of time. To draw velocity-time graph, velocity of the body is plotted along V-axis and the time taken by the body is plotted along X-axis. | ||||||||||||||||
| The area under velocity-time graph gives displacement. | ||||||||||||||||
| ||||||||||||||||
A) 2.25\[{{\operatorname{ms}}^{-2}}\]
B) 6.25\[{{\operatorname{ms}}^{-2}}\]
C) 7\[{{\operatorname{ms}}^{-2}}\]
D) 7.85\[{{\operatorname{ms}}^{-2}}\]
Correct Answer: B
Solution :
| [b] From given graph, initial velocity, |
| u = 30 m/s |
| Final velocity, v = 0 m/s |
| Time, t = 4.8 s |
| As we know, v = u + at |
| \[\Rightarrow \] \[a=\frac{v-u}{t}=\frac{0-30}{4.8}=6.25\operatorname{m}/{{s}^{2}}\] |
| Thus, deceleration is 6.25 \[\operatorname{m}/{{s}^{2}}\]. |


You need to login to perform this action.
You will be redirected in
3 sec