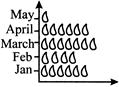
question_answer11) If ![]() stands for 60, how much does
stands for 60, how much does ![]() stands for?
stands for?
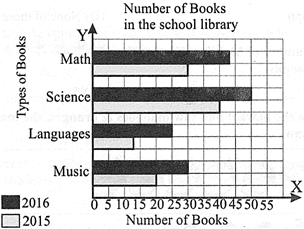
question_answer23) What is the other name for bar diagrams?
question_answer28) What is a graph drawn using vertical bars called?
question_answer29) What is the number of Mobile represent the ![]() If each symbol represent 10 mobile?
If each symbol represent 10 mobile?


You need to login to perform this action.
You will be redirected in
3 sec


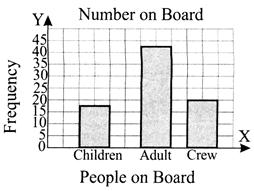
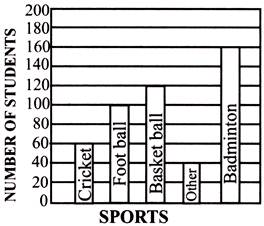 How many more students like basketball than football?