0
question_answer1) Which one of the following curves represents the variation of impedance (Z) with frequency f in series LCR circuit
question_answer2) The variation of the instantaneous current (I) and the instantaneous emf (E) in a circuit is as shown in fig. Which of the following statements is correct
question_answer3) The figure shows variation of R, XL and XC with frequency f in a series L, C, R circuit. Then for what frequency point, the circuit is inductive
question_answer4) An alternating emf is applied across a parallel combination of a resistance R, capacitance C and an inductance L. If IR, IL, IC are the currents through R, L and C respectively, then the diagram which correctly represents, the phase relationship among IR, IL, IC and source emf E, is given by
question_answer5) An ac source of variable frequency f is connected to an LCR series circuit. Which one of the graphs in figure. represents the variation of current of current I in the circuit with frequency f
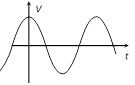
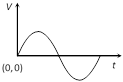
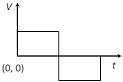
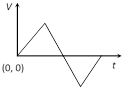
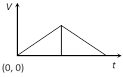
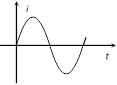
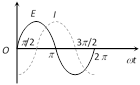
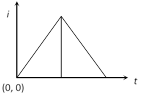
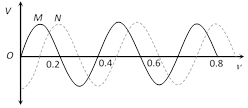
question_answer6) The r.m.s. voltage of the wave form shown is
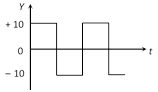
question_answer7) A constant voltage at different frequencies is applied across a capacitance C as shown in the figure. Which of the following graphs Correctly depicts the variation of current with frequency ?
question_answer8) The output current versus time curve of a rectifier is shown in the figure. The average value of output current in this case is [AIIMS 1982]
question_answer9) The current 'i' in an inductance coil varies with time 't' according to following graph Which one of the following plots shows the variations of voltage in the coil [CBSE PMT 1994]
question_answer10) When an ac source of e.m.f. \[e={{E}_{0}}\]\[\sin (100\,t)\] is connected across a circuit, the phase difference between the e.m.f. e and the current i in the circuit is observed to be \[\pi /4\], as shown in the diagram. If the circuit consists possibly only of RC or LC in series, find the relationship between the two elements [IIT-JEE (Screening) 2003]
question_answer11) Two sinusoidal voltages of the same frequency are shown in the diagram. What is the frequency, and the phase relationship between the voltages Frequency in Hz Phase lead of N over M in radians
question_answer12) The voltage across a pure inductor is represented by the following diagram. Which one of the following diagrams will represent the current [MP PMT 1995]
question_answer13) In pure inductive circuit, the curves between frequency f and reciprocal of inductive reactance 1/XL is
question_answer14) The vector diagram of current and voltage for a circuit is as shown. The components of the circuit will be
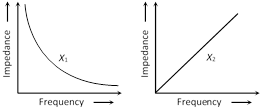
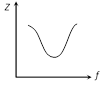
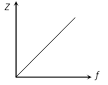
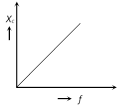
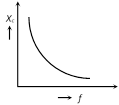
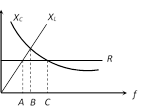
question_answer15) The resonance point in \[{{X}_{L}}-f\] and \[{{X}_{C}}-f\] curves is
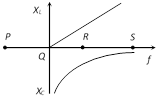
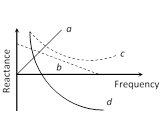
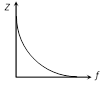
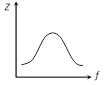
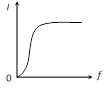
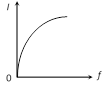
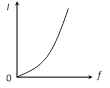
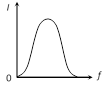
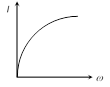
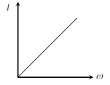
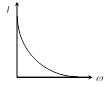
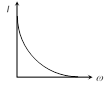
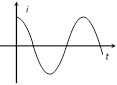
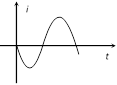
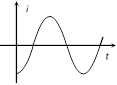
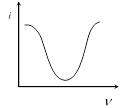
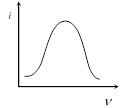
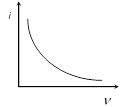
question_answer16) The i - n curve for anti-resonant circuit is
question_answer17) The graphs given below depict the dependence of two reactive impedances X1 and X2 on the frequency of the alternating e.m.f. applied individually to them. We can then say that [Haryana CEE 1996; RPMT 2004]
question_answer18) Which of the following plots may represent the reactance of a series LC combination [MP PMT 1999]
question_answer19) Which of the following curves correctly represents the variation of capacitive reactance XC with frequency f [RPMT 1996]
Please Wait you are being redirected....
You need to login to perform this action.You will be redirected in 3 sec
OTP has been sent to your mobile number and is valid for one hour
Your mobile number is verified.