
| Age group | Number of persons |
| 1-14 | 2 lakh |
| 15-29 | 1 lakh 60 thousands |
| 30-40 | 1 lakh 20 thousands |
| 45-59 | 1 lakh 20 thousands |
| 60-74 | 80 thousands |
| 75 and above | 40 thousands |
Answer:
To draw the bar graph, we will use the following steps. Firstly, draw two perpendicular lines, one is horizontal and one is vertical. Along the horizontal line mark 'age-group' and along vertical line mark 'number of persons'. (ii) Now, take scale of 1 unit length = 20000 along the vertical line and then mark the corresponding values. Also, the heights of bars for various groups are as follows:
(iii) Draw bar of equal width and of height calculated in Step (ii) on the horizontal line with equal gap between them. Thus, we get the following bar graph 1-14 \[\frac{200000}{20000}=10\text{units}\] 15-29 \[\frac{160000}{20000}=8\text{units}\] 30-44 \[\frac{120000}{20000}=6\text{units}\] 45-59 \[\frac{120000}{20000}=6\text{units}\] 60-74 \[\frac{80000}{20000}=4\text{units}\] 75 and above \[\frac{40000}{20000}=2\text{units}\] 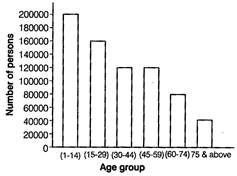 (a) From bar graph, we see that the lengths of bars for age group 30-44 and 45-59 are same, so age group (30-44) and (45-559) have the same population. (b) \[\because \] persons having age 60 or above are called senior citizens. \[\therefore \] Number of senior citizens in the town = Number of persons of age group (60-74) + Number of persons of age 75 and above = 80000 + 40000 = 120000






You need to login to perform this action.
You will be redirected in
3 sec