| Favourite Sport | Cricket | Basket Ball | Swimming | Hockey | Athletics |
| Watching | 1240 | 470 | 510 | 430 | 250 |
| Participating | 620 | 320 | 320 | 250 | 105 |
Answer:
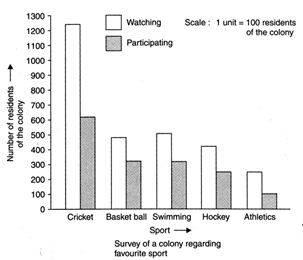 (i) We infer from the bar graph that the residents of the colony like cricket, the most and athletics, the least. (ii) Cricket is most popular. (iii) Watching is preferred more than participating.


You need to login to perform this action.
You will be redirected in
3 sec

