Answer:
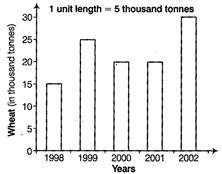
(a) From the given bar graph, we can say that maximum production is shown by largest bar (i.e. 30 thousand tonnes) for the year 2002. (b) From the given bar graph, we can say that minimum production is shown by the smallest bar (i.e. 15 thousand tonnes) for the year 1998.


You need to login to perform this action.
You will be redirected in
3 sec

