|
|
0 | 11.8 | 23.4 | 36.0 | 50.8 | 58.2 | 64.5 | 72.1 |
|
|
0 | 54.9 | 110.1 | 202.4 | 322.7 | 405.9 | 454.1 | 521.1 |
|
|
632.8 | 548.1 | 469.4 | 359.7 | 257.7 | 193.6 | 161.2 | 120.7 |
Answer:
![]()
0
1.118
0.234
0.360
0.508
0.582
0.645
0.721
![]()
0
54.9
110.1
20.4
322.7
405.9
454.1
521.1
![]()
632.8
548.1
469.4
359.7
257.7
193.6
161.2
120.7
![]()
632.8
603.8
579.5
562.1
580.4
599.4
615.3
641.8
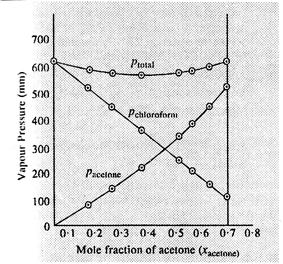 As the plot for ptotal, dips
downwards, hence the solution shows negative deviation from the ideal
behaviour.
As the plot for ptotal, dips
downwards, hence the solution shows negative deviation from the ideal
behaviour.


You need to login to perform this action.
You will be redirected in
3 sec

