 Fig. 3.91
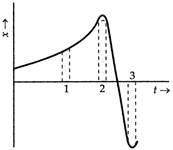
Answer:
Slope of x-t graph in a small time interval
= Average speed in that interval
As the slope of x-t is greatest in interval 3 and least in interval 1, so the average speed is greatest in interval 3 and least in interval 1.
As the slope of x-t is positive in intervals 1 and 2 and negative in interval 3, so average velocity is positive in intervals 1 and 2 and negative in interval 3.


You need to login to perform this action.
You will be redirected in
3 sec

