-
question_answer1)
The line plot below shows how students scored on last week's maths test.
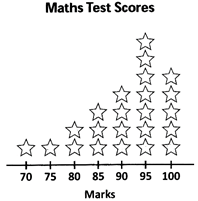
Key: Each

= 1 student How many students scored 95 or higher on the test?
A)
5 done
clear
B)
7 done
clear
C)
12 done
clear
D)
16 done
clear
View Solution play_arrow
-
question_answer2)
If

stands for 30, how much does

stand for?
A)
6 done
clear
B)
10 done
clear
C)
12 done
clear
D)
26 done
clear
View Solution play_arrow
-
question_answer3)
Direction: Questions 3 are based on this table and pictograph which show the number of school teachers in some cities.
| Name of the City |
Number of School Teachers |
| Hyderabad |
4200 |
| Delhi |
2400 |
| Chennai |
3000 |
| Name of the Cities |
Number of School Teachers |
| Hyderabad |
 |
| Chennai |
 |
How many school teachers does

represent?
A)
500 done
clear
B)
600 done
clear
C)
700 done
clear
D)
800 done
clear
View Solution play_arrow
-
question_answer4)
Direction: Questions 4 are based on this table and pictograph which show the number of school teachers in some cities.
| Name of the City | Number of School Teachers |
| Hyderabad | 4200 |
| Delhi | 2400 |
| Chennai | 3000 |
| Name of the Cities | Number of School Teachers |
| Hyderabad |  |
| Chennai |  |
Which of the following is the correct representation of the number of school teachers in Delhi?
A)
B)
C)
D)
View Solution play_arrow
-
question_answer5)
If

represents 5 balloons, number of symbols to be drawn to represent 60 balloons is
A)
5 done
clear
B)
60 done
clear
C)
10 done
clear
D)
12 done
clear
View Solution play_arrow
-
question_answer6)
A)
Tuesday done
clear
B)
Wednesday done
clear
C)
Friday done
clear
D)
Saturday done
clear
View Solution play_arrow
-
question_answer7)
A)
300 done
clear
B)
330 done
clear
C)
350 done
clear
D)
420 done
clear
View Solution play_arrow
-
question_answer8)
A)
20 done
clear
B)
30 done
clear
C)
40 done
clear
D)
50 done
clear
View Solution play_arrow
-
question_answer9)
If O represents 5 eggs how many eggs does OOOO represent?
A)
4 done
clear
B)
16 done
clear
C)
20 done
clear
D)
25 done
clear
View Solution play_arrow
-
question_answer10)
If

stands for 300, what does

stand for?
A)
60 done
clear
B)
100 done
clear
C)
120 done
clear
D)
260 done
clear
View Solution play_arrow
-
question_answer11)
Direction: Questions 11 and 12 are based on this table and pictograph which show the number of government employees in some places.
| Name of the Place |
Number of Govt. Employees |
| X |
4800 |
| Y |
4200 |
| Z |
2400 |
| Name of the Place |
Number of Govt. Employees |
| X |
 |
| Y |
 |
How many employees does a

represent?
A)
500 done
clear
B)
600 done
clear
C)
700 done
clear
D)
800 done
clear
View Solution play_arrow
-
question_answer12)
Direction: Questions 11 and 12 are based on this table and pictograph which show the number of government employees in some places.
| Name of the Place |
Number of Govt. Employees |
| X |
4800 |
| Y |
4200 |
| Z |
2400 |
| Name of the Place |
Number of Govt. Employees |
| X |
 |
| Y |
 |
Which of the following is the correct representation of the number of employees in Z?
A)
B)
C)
D)
View Solution play_arrow
-
question_answer13)
What is the number of houses represented by the figure

if each symbol represents 15 houses?
A)
60 done
clear
B)
20 done
clear
C)
15 done
clear
D)
40 done
clear
View Solution play_arrow
-
question_answer14)
A symbol is used to represent 100 flowers. How many symbols are to be drawn to show 800 flowers?
A)
8 done
clear
B)
12 done
clear
C)
10 done
clear
D)
80 done
clear
View Solution play_arrow
-
question_answer15)
A)
1000 done
clear
B)
1500 done
clear
C)
5000 done
clear
D)
2000 done
clear
View Solution play_arrow
-
question_answer16)
A)
3000 done
clear
B)
1500 done
clear
C)
1250 done
clear
D)
2000 done
clear
View Solution play_arrow
-
question_answer17)
A)
1985 done
clear
B)
1995 done
clear
C)
1990 done
clear
D)
2000 done
clear
View Solution play_arrow
-
question_answer18)
If one

symbol represents 10 children, how many children are represented by

?
A)
5 done
clear
B)
25 done
clear
C)
15 done
clear
D)
20 done
clear
View Solution play_arrow
-
question_answer19)
What is a graph drawn using vertical bars called?
A)
A bar graph done
clear
B)
A line graph done
clear
C)
A pictograph done
clear
D)
A pie graph done
clear
View Solution play_arrow
-
question_answer20)
If

represents 12 men then how many men does

represent?
A)
5 done
clear
B)
50 done
clear
C)
6 done
clear
D)
60 done
clear
View Solution play_arrow
-
question_answer21)
Direction: The pictograph shows the number of pupils from 4 classes in a school who scored 5As in a competitive examination.

Key: Each

represents 2 pupils. How many pupils from 6 Lily scored 5As?
A)
2 done
clear
B)
8 done
clear
C)
6 done
clear
D)
4 done
clear
View Solution play_arrow
-
question_answer22)
Direction: The pictograph shows the number of pupils from 4 classes in a school who scored 5As in a competitive examination.
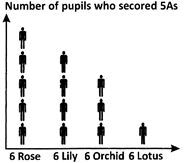
Key: Each

represents 2 pupils. How many more pupils in 6 Rose than in 6 Orchid scored 5As ?
A)
2 done
clear
B)
10 done
clear
C)
6 done
clear
D)
4 done
clear
View Solution play_arrow
-
question_answer23)
Direction: The pictograph shows the number of pupils from 4 classes in a school who scored 5As in a competitive examination.
Key: Each
represents 2 pupils. In which class, did only 2 pupils get 5As ?
A)
6 Lotus done
clear
B)
6 Orchid done
clear
C)
6 Lily done
clear
D)
6 Rose done
clear
View Solution play_arrow
-
question_answer24)
Direction: The pictograph shows the number of pupils from 4 classes in a school who scored 5As in a competitive examination.
Key: Each
represents 2 pupils. What is the total number of students who scored 5As in that school?
A)
13 done
clear
B)
12 done
clear
C)
26 done
clear
D)
30 done
clear
View Solution play_arrow
-
question_answer25)
Direction: The bar graph given shows the number of books borrowed from a school library in a certain week.

How many books were borrowed on Friday?
A)
60 done
clear
B)
40 done
clear
C)
55 done
clear
D)
50 done
clear
View Solution play_arrow
-
question_answer26)
Direction: The bar graph given shows the number of books borrowed from a school library in a certain week.
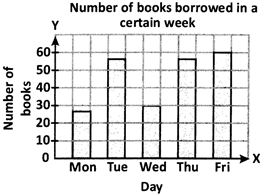
Find the total number of books borrowed that week.
A)
125 done
clear
B)
260 done
clear
C)
240 done
clear
D)
225 done
clear
View Solution play_arrow
-
question_answer27)
The given pictograph shows the number of pupils in 4 different classes.
Key: Each

represents 5 pupils. What is the total number of pupils in all the 4 classes ?
A)
80 done
clear
B)
95 done
clear
C)
100 done
clear
D)
105 done
clear
View Solution play_arrow
-
question_answer28)
The given figure is incomplete. It is a pictograph which shows the number of sweets each child has.
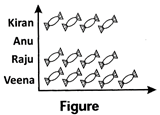
Key: Each

represents 2 sweets. The total number of sweets the four children have is 30. How many sweets does Anu have?
A)
2 done
clear
B)
4 done
clear
C)
6 done
clear
D)
8 done
clear
View Solution play_arrow
-
question_answer29)
The given pictograph shows the number of water filters which were sold from January to April.
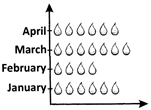
Key: Each

represents 4 units of water filter. How many water filters were sold altogether from January to April?
A)
56 done
clear
B)
92 done
clear
C)
84 done
clear
D)
23 done
clear
View Solution play_arrow
-
question_answer30)
The given bar graph shows the amount of money Rina spent in her school canteen last week from Monday to Thursday.
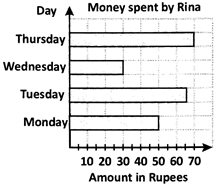
On Thursday, Rina spent her money on 2 packets of sweets. How much did each packet cost?
A)
Rs. 15 done
clear
B)
Rs. 25 done
clear
C)
Rs. 35 done
clear
D)
Rs. 40 done
clear
View Solution play_arrow
-
question_answer31)
The pictograph shows the number of books read by 4 pupils last year.
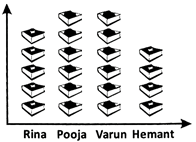
Key: Each

represents 3 books. How many more books were read by Varun than by Hemant?
A)
6 done
clear
B)
10 done
clear
C)
12 done
clear
D)
18 done
clear
View Solution play_arrow
-
question_answer32)
The given bar chart shows the number of eggs sold by a farmer in different weeks.
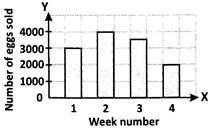
Which of the following statements is true?
A)
4000 eggs were sold in week 3. done
clear
B)
1000 eggs more were sold in week 3 than in week 1. done
clear
C)
The eggs sold in week 2 is twice as many eggs sold in week 4. done
clear
D)
The total number of eggs sold in all the 4 weeks is 12000. done
clear
View Solution play_arrow
-
question_answer33)
The given bar graph shows the number of different types of vehicles travelling along a certain road on a certain day.
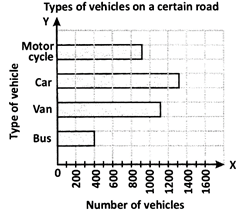
What is the total number of vehicles which travelled along the road on that day?
A)
3700 done
clear
B)
2800 done
clear
C)
3200 done
clear
D)
2900 done
clear
View Solution play_arrow
-
question_answer34)
The pictograph shows the number of beads of different colours in a box. The number of yellow beads is not shown.
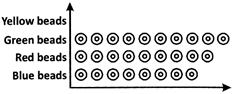
Key: Each

represents 15 beads. Altogether there are 510 beads in the box. How many

must be drawn in the pictograph to represent the yellow beads?
A)
5 done
clear
B)
6 done
clear
C)
7 done
clear
D)
8 done
clear
View Solution play_arrow
-
question_answer35)
The pictograph shows the sales of cars in 4 weeks by a car dealer. The pictograph is incomplete.
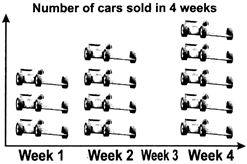
Key: Each

represents 2 cars. If 4 more cars were sold in week 3 than in week 1, how many
must be drawn in the pictograph above for week 3?
A)
2 done
clear
B)
5 done
clear
C)
8 done
clear
D)
6 done
clear
View Solution play_arrow
-
question_answer36)
A)
S done
clear
B)
M done
clear
C)
L done
clear
D)
XL done
clear
View Solution play_arrow
-
question_answer37)
A)
20 done
clear
B)
2 done
clear
C)
200 done
clear
D)
100 done
clear
View Solution play_arrow
-
question_answer38)
A)
30 done
clear
B)
3 done
clear
C)
45 done
clear
D)
60 done
clear
View Solution play_arrow
-
question_answer39)
A)
The number of size M hats sold is the same as the number of size L hats sold. done
clear
B)
The number of size M hats sold is the same as the total number of hats sold of size Land size XL done
clear
C)
The number of hats of size L is the least sold. done
clear
D)
The number of hats of size XL is the maximum sold. done
clear
View Solution play_arrow
-
question_answer40)
The given pictograph shows the amount of money Pooja saved in a week.
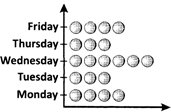
Key: Each

represents Rs. 10. How much more money did Pooja save on Wednesday than on Monday?
A)
Rs. 15 done
clear
B)
Rs. 20 done
clear
C)
Rs. 25 done
clear
D)
Rs. 10 done
clear
View Solution play_arrow
-
question_answer41)
The given bar graph is incomplete. It shows the number of stamps each pupil has.
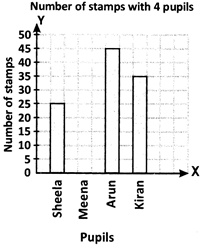
The total number of stamps the four children have is 150. How many stamps does Meena have?
A)
25 done
clear
B)
30 done
clear
C)
15 done
clear
D)
45 done
clear
View Solution play_arrow
-
question_answer42)
Direction: On a plane to Delhi, the number of children, adults and crew were recorded. Based on the bar chart, answer the following questions.
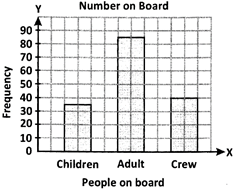
How many children, adults and crew were on board?
A)
155 done
clear
B)
160 done
clear
C)
140 done
clear
D)
180 done
clear
View Solution play_arrow
-
question_answer43)
Direction: On a plane to Delhi, the number of children, adults and crew were recorded. Based on the bar chart, answer the following questions.
How many more adult passengers were on board compared to children?
A)
45 done
clear
B)
40 done
clear
C)
50 done
clear
D)
55 done
clear
View Solution play_arrow
-
question_answer44)
Direction: On a plane to Delhi, the number of children, adults and crew were recorded. Based on the bar chart, answer the following questions.
What is the ratio of the number of crew to the number of adult passengers?
A)
8:17 done
clear
B)
20:43 done
clear
C)
17:8 done
clear
D)
17:20 done
clear
View Solution play_arrow
-
question_answer45)
Direction: Maruti Motors is a car repair shop. The bar chart below shows the number of cars repaired in a week.
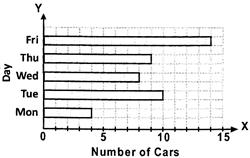
How many cars were repaired on Wednesday?
A)
6 done
clear
B)
8 done
clear
C)
4 done
clear
D)
15 done
clear
View Solution play_arrow
-
question_answer46)
Direction: Maruti Motors is a car repair shop. The bar chart below shows the number of cars repaired in a week.
What percentage of the cars were repaired on Thursday
A)
35% done
clear
B)
15% done
clear
C)
25% done
clear
D)
20% done
clear
View Solution play_arrow
-
question_answer47)
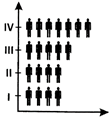
Direction: The bar chart shows the number of waiters and waitresses employed in four restaurants at a shopping centre.
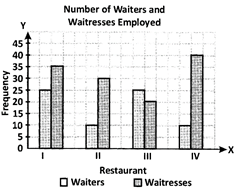
Which restaurants had 10 waiters?
A)
I and IV done
clear
B)
I and II done
clear
C)
II and IV done
clear
D)
II and III done
clear
View Solution play_arrow
-
question_answer48)
Direction: The bar chart shows the number of waiters and waitresses employed in four restaurants at a shopping centre.
What was the total number of waiters employed in the 4 restaurants?
A)
75 done
clear
B)
65 done
clear
C)
70 done
clear
D)
60 done
clear
View Solution play_arrow
-
question_answer49)
Direction: The bar chart shows the number of waiters and waitresses employed in four restaurants at a shopping centre.
Find the total number of waitresses in the 4 restaurants.
A)
130 done
clear
B)
125 done
clear
C)
115 done
clear
D)
120 done
clear
View Solution play_arrow
-
question_answer50)
Direction: The bar chart given shows the number of non-fiction books in a school library for the year 2009 and 2010.
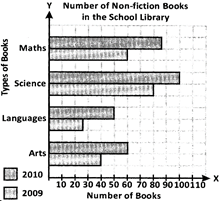
What was the total number of non-fiction books in the years 2009 and 2010?
A)
500 done
clear
B)
205 done
clear
C)
295 done
clear
D)
495 done
clear
View Solution play_arrow
-
question_answer51)
Direction: The bar chart given shows the number of non-fiction books in a school library for the year 2009 and 2010.
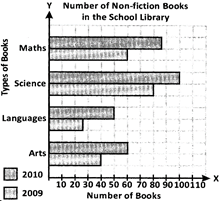
Find the increase in the number of books in 2010.
A)
85 done
clear
B)
90 done
clear
C)
100 done
clear
D)
190 done
clear
View Solution play_arrow
-
question_answer52)
Direction: The bar chart given shows the number of non-fiction books in a school library for the year 2009 and 2010.
How many more science books were there in 2010 compared to 2009?
A)
200 done
clear
B)
40 done
clear
C)
20 done
clear
D)
80 done
clear
View Solution play_arrow
-
question_answer53)
Direction: The bar chart given shows the number of non-fiction books in a school library for the year 2009 and 2010.
State the type of non-fiction books that had doubled from 2009 to 2010.
A)
Maths done
clear
B)
Arts done
clear
C)
Science done
clear
D)
Languages done
clear
View Solution play_arrow
-
question_answer54)
If one

symbol represents 100 balls how many symbols are to be drawn to represent 600 balls?
A)
5 done
clear
B)
6 done
clear
C)
7 done
clear
D)
8 done
clear
View Solution play_arrow
-
question_answer55)
What is the representation of an information through pictures called?
A)
A line graph done
clear
B)
A bar graph done
clear
C)
A pictograph done
clear
D)
A pie chart done
clear
View Solution play_arrow
-
question_answer56)
A)
50 huts were sold in January. done
clear
B)
The highest number of huts sold in a month is 5. done
clear
C)
60 huts more were sold in February than in March. done
clear
D)
The total number of huts sold in the 3 months is 110. done
clear
View Solution play_arrow
-
question_answer57)
If \[\Delta \Delta \Delta \Delta \Delta \] stands for 40, what will \[\Delta \Delta \Delta \] stand for?
A)
20 done
clear
B)
24 done
clear
C)
28 done
clear
D)
32 done
clear
View Solution play_arrow
-
question_answer58)
The table shows the number of children in each of the 35 families surveyed. Which of the following workings to calculate the percentage of families with more than 3 children, is correct?
| Number of Children |
Tally |
| 2 |
\[||||\] |
| 3 |
\[\cancel{||||}\cancel{||||}\] |
| 4 |
\[\cancel{||||}\] \[||\] |
| 5 |
\[\cancel{||||}\] \[|||\] |
| 6 |
\[\cancel{||||}\]\[|\] |
A)
\[\frac{10}{35}\times 100%\] done
clear
B)
\[\frac{14}{35}\times 100%\] done
clear
C)
\[\frac{21}{35}\times 100%\] done
clear
D)
\[\frac{31}{35}\times 100%\] done
clear
View Solution play_arrow
-
question_answer59)
What is the other name for bar diagrams?
A)
Column graphs done
clear
B)
Row graphs done
clear
C)
Line graphs done
clear
D)
Pie graphs done
clear
View Solution play_arrow
-
question_answer60)
If one symbol of

represents 10 bottles of coke then how are 25 bottles of coke represented?
A)
B)
C)
D)
View Solution play_arrow
-
question_answer61)
A)
\[\text{10 }\!\!%\!\!\text{ }\] done
clear
B)
\[\text{25 }\!\!%\!\!\text{ }\] done
clear
C)
\[37\frac{1}{2}%\] done
clear
D)
\[\text{50 }\!\!%\!\!\text{ }\] done
clear
View Solution play_arrow
-
question_answer62)
A)
31 done
clear
B)
3 done
clear
C)
19 done
clear
D)
30 done
clear
View Solution play_arrow
-
question_answer63)
A)
30 done
clear
B)
27 done
clear
C)
29 done
clear
D)
28 done
clear
View Solution play_arrow
-
question_answer64)
A)
600 done
clear
B)
650 done
clear
C)
750 done
clear
D)
700 done
clear
View Solution play_arrow
-
question_answer65)
A)
Bhanu, Hari, Gopal done
clear
B)
Gopal, Hari, Kiran done
clear
C)
Gopal, Hari, Bhanu done
clear
D)
Hari, Kiran, Bhanu done
clear
View Solution play_arrow
-
question_answer66)
A)
The number of girls in class V is\[\text{2}\frac{1}{2}\] . done
clear
B)
The number of girls in class VI is less than those in class II. done
clear
C)
The number of girls in class I is 6. done
clear
D)
The number of girls in class VI is 20. done
clear
View Solution play_arrow
-
question_answer67)
A)
15 done
clear
B)
27 done
clear
C)
12 done
clear
D)
18 done
clear
View Solution play_arrow