| Define market supply. Explain the factor 'input prices' that can cause a change in supply. |
| Or |
| Give the behaviour of marginal product and total product as more and more units of only one input are employed while keeping other inputs as constant. |
Answer:
Market supply is a table showing various amount of a commodity that all the firms/producers in the industry are willing to sell at different possible prices of that commodity. For example: The table is showing market supply. It is based on the ansumption that there are only two firms (A Band B) supplying Good-X in the market
Market Supply Schedule
Px (Price of Good-x) (Rs)
Qx ( firm ?A?) (Unit)
Qx (firm ?B?) (Units)
Market supply (Units)
5
0
0
0
10
10
5
10+5=10
15
20
10
20+10=30
20
30
15
30+15=45
The above table shows the total market supply assuming only two firms in the market.
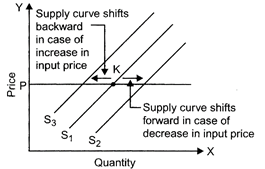
Effect of ?input prices? causing change in supply: Input price may increase or decrease. In case of increase in input price. Cost of production tends to rise hence producers will supply less of the commodity at its existing price. It will cause the backward shifting of the supply survey. Opposite will happen in case of decrease in input price. Cost of production tends to decline hence more supply of the commodity will be given at the existing price of the commodity. In such case forward shifting of supply curve will take place.
Or
Consider a situation when land is a fixed factor and labour is a variable factor and the farmer is producing wheat. Since land is a fixed factor, he can produce more of wheat only by using more and more of labour. As more and more labour is applying on a fixed piece of land total productivity increases but at a diminishing rate. It occurs due to the operation of law of variable proportion. It can be understood by the following table:
Units of Land
Units of Libour
Total Product
Marginal Product
Remarks
1
1
2
2
Increasing MP implying increasing returns to a factor
1
2
5
3
1
3
9
4
1
4
12
3
Diminishing MP implying diminishing returns to a factor
1
5
14
2
1
6
15
1
1
7
15
0
1
8
14
-1
Negative MP implying negative returns to a factors
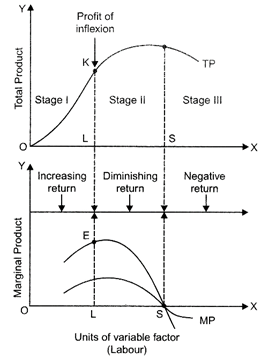
The above figure shows:
(1) MP tends to rise till OL units of labour are used. This corresponds to point E on the MP curve. It shows increasing returns to a factor.
(2) When MP is rising TP tends to rise at an increasing rate. This occurs till point K on the TP curve. This corresponds to the situation of increasing returns to a factor.
(3) Beyond OL units of labour. MP tends to decline and TP increases only at diminshing rate. It occurs between E and S on MP curve and between K and T on TP curve. This is a situation of diminishing returns to a factor.
(4) When employment of labour exceeds OS units, MP becomes negative. Accordingly, TP starts declining. This is a situation of negative returns to a factor, occured beyond point T. TP curve and beyond S on MP curve.


You need to login to perform this action.
You will be redirected in
3 sec

