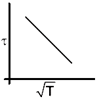
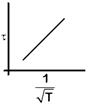
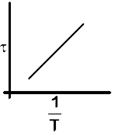
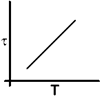
JEE Main & Advanced JEE Main Paper Phase-I (Held on 08-1-2020 Morning)

  • question_answer
    The plot that depicts the behavior of the mean Free time \[\tau \] (time between two successive collisions) for the molecules of an ideal gas, as a function of temperature (T), qualitatively, is (Graphs are schematic and not drawn to scale) [JEE MAIN Held On 08-01-2020 Morning]

    A)

    B)

    C)

    D)

    Correct Answer: B

    Solution :

    [b] Relaxation time \[(\tau )\propto \frac{mean\text{ }free\text{ }path}{speed}\] \[\therefore \tau \propto \frac{1}{V}\] or \[\tau \propto \frac{1}{\sqrt{T}}\] Graph between\[\tau \,\,\text{v/s}\frac{1}{\sqrt{T}}\] is a straight line,


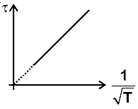
You need to login to perform this action.
You will be redirected in 3 sec spinner