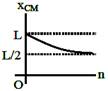
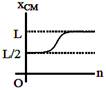
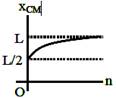
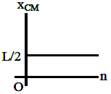
JEE Main & Advanced AIEEE Solved Paper-2008

  • question_answer
    A thin rod of length ?L? is lying along the x-axis with its ends at \[x=0\] and \[x=L\]. Its linear density (mass/length) varies with x as \[k{{\left( \frac{x}{L} \right)}^{n}}\], where ?n? can be zero or any positive number. If the position \[{{x}_{CM}}\] of the centre of mass of the rod is plotted against ?n?, which of the following graphs best approximates the dependence of \[{{x}_{CM}}\] on n?       AIEEE  Solved  Paper-2007

    A)

    B)

    C)       

    D)  

    Correct Answer: C

    Solution :

                    \[{{x}_{CM}}=\frac{\int{x\,\,dm}}{\int{\,\,\,dm}}=\frac{\int\limits_{0}^{L}{x\,\,k{{\left( \frac{x}{L} \right)}^{n}}dx}}{\int\limits_{0}^{L}{k{{\left( \frac{x}{L} \right)}^{n}}dx}}=\frac{\left( n+1 \right)L}{\left( n+2 \right)}\] If \[n=0,\,\,{{x}_{cm}}=\frac{L}{2}\] and if \[n\to \infty \,\,{{x}_{cm}}=L\]


You need to login to perform this action.
You will be redirected in 3 sec spinner