Answer:
For a typical semiconductor graph of resistivity versus temperature is given below: 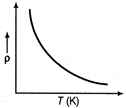 Resistivity versus temperature graph


You need to login to perform this action.
You will be redirected in
3 sec

