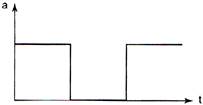
 Which of the following graphs correctly represents the velocity-time graph?
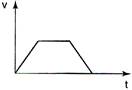
A)
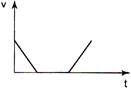
B)
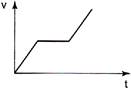
C)
D)
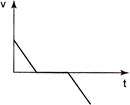
Correct Answer: C
Solution :
[c] When acceleration [a] is constant, velocity (v) increases uniformly with time and when a = 0, velocity remains constant.


You need to login to perform this action.
You will be redirected in
3 sec

