| Year | Number of student |
| 1995 | 1400 |
| 1996 | 1600 |
| 1997 | 1250 |
| 1998 | 1000 |
| 1999 | 2000 |
| 2000 | 2200 |
Answer:
In order to construct a bar graph representing the above data. We follow the following steps: (a) Take a graph paper and draw two mutually perpendicular lines OX and OY as shown in Fig. Call OX as the horizontal axis and OY as the vertical axis. (b) Along OX, mark ?years? and along OY, mark ?number of students?. (c) Along OX, choose the uniform (equal) width of the bars and the uniform gap between them, according to the space available for the graph. (d) Choose a suitable scale to determine the heights of the bars, according to the availability of space. Here, we choose 1 big division to represent 200 students. (e) Calculate the height of various bars as follows: The height of the bar for the year 1995 is equal to \[\frac{1400}{200}=7\]big divisions; The height of the bar for the year 1996 =\[\frac{1600}{200}\]= 8 big divisions The height of the bar for the year 1997 =\[\frac{1250}{200}\]big divisions = 6 big divisions and 2.5 small divisions The height of the bar for the year 1998 =\[\frac{1000}{200}\]= 5 big divisions The height of the bar for the year 1999 =\[\frac{2000}{200}\]= 10 big divisions The height of the bar for the year 2000 =\[\frac{2200}{200}\]= 11 big divisions. (f) We draw the bars as shown in Fig. below and on the top of each bar we write the number of students represented by it. 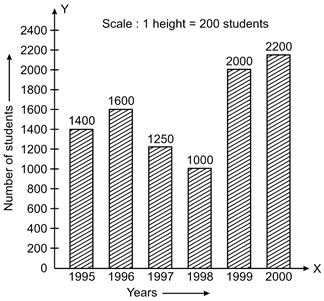


You need to login to perform this action.
You will be redirected in
3 sec

