A) \[0.259\,J{{K}^{-1}}\] and \[{{T}_{1}}<{{T}_{2}}\]
B) \[8.314\,J\,mo{{l}^{-1}}{{K}^{-1}}\]and \[{{T}_{1}}>{{T}_{2}}\]
C) \[0.259\,J\,{{K}^{-1}}\] and \[{{T}_{1}}>{{T}_{2}}\]
D) \[4.28\,J\,{{K}^{-1}}\] and \[{{T}_{1}}<{{T}_{2}}\]
Correct Answer: C
Solution :
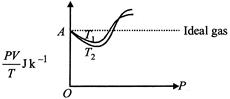
| \[PV=\mu RT=\frac{m}{M}RT,\] where w = mass of the gas |
| and \[\frac{m}{M}=\mu =\] number of moles. |
| \[\frac{PV}{T}=\mu R=\] a constant for all values of P. |
| That is why, ideally it is a straight line. |
| \[\therefore \,\,\frac{PV}{T}=\frac{1g}{32\,g\,mo{{l}^{-1}}}\times 8.31J\,mo{{l}^{-1}}{{K}^{-1}}=0.259J{{K}^{-1}}\]Also, \[{{T}_{1}}>{{T}_{2}}\] |


You need to login to perform this action.
You will be redirected in
3 sec

