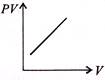
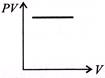
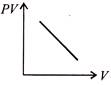
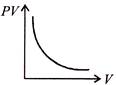
JEE Main & Advanced Sample Paper JEE Main - Mock Test - 43

  • question_answer
    Which one the following graphs represents the behavior of an ideal gas at constant temperature?

    A)

    B)

    C)

    D)       

    Correct Answer: B

    Solution :

    For an ideal gas at constant temperature PV = constant i.e. PV doesn't vary with V.


You need to login to perform this action.
You will be redirected in 3 sec spinner