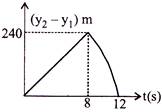
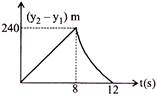
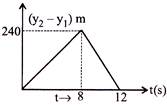
| Two stones are thrown up simultaneously from the edge of a cliff 240 m high with initial speed of \[10\text{ }m/s\]and \[40\text{ }m/s\] respectively. Which of the following graph best represents the time variation of relative position of the second stone with respect to the first? |
| (Assume stones do not rebound after hitting the ground and neglect air resistance, take \[g=10\,m/{{s}^{2}}\]) |
| (The figures are schematic and not drawn to scale) |
A)
B)
C)
D)
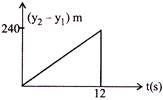
Correct Answer: B
Solution :
\[{{y}_{1}}=10t-5{{t}^{2}};\] \[{{y}_{2}}=40t-5{{t}^{2}}\] for \[{{y}_{1}}=-240m,\,t=8s\] \[\therefore \,\,{{y}_{2}}-{{y}_{1}}=30t\]for \[t\le 8s.\] for \[t>8s,\,\,{{y}_{2}}-{{y}_{1}}=240-40t-\frac{1}{2}g{{t}^{2}}\]


You need to login to perform this action.
You will be redirected in
3 sec

