Answer:
Demand Schedule It is a table showing different quantities of goods that people are prepared to buy at different level of price. In other words, the Law of Demand or demand function stated in a tabular form is termed as demand schedule. Demand schedule can further be classified as follows: (i) Individual Demand Schedule The schedule that shows the demand by an individual household for a commodity at different prices is known, as individual demand schedule. Example or individual demand schedule:
(ii) Market Demand Schedule The schedule that shows the demand of all the households for a commodity at different prices is known as market demand schedule. Example of market demand schedule: Price of Milk (Rs. Per litre) 4 3 2 1 Mohan?s Demand for Milk (litre) 2 3 5 8
(Note It has been assumed that market consists of two households only) Demand Curve A demand curve is the graphical representation of demand schedule showing the demand relationship between price of the commodity and its demand. It is a downward sloping curve. Demand curve is of two types as given below: (i) Individual Demand Curve A curve which shows the various quantities of a commodity demanded by a particular household at various levels of price is known as individual demand curve. It is the graphical representation of individual demand schedule. Price of Milk (Rs. Per litre) Mohan?s Demand for Milk (in litre) Sohan?s Demand for Milk(in litre) Market Demand for Milk (in litre) 4 1 1 \[1+1=2\] 3 3 2 \[3+2=5\] 2 5 4 \[5+4=9\] 1 7 5 \[7+5=12\] 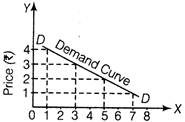 Quantity (units) Diagram Showing Mohan's Demand Curve (ii) Market Demand Curve Market demand curve is the horizontal summation of individual demand curve i.e. it is a curve which shows the various quantities of a commodity demanded by the whole market at various prices. It is the graphical representation of market demand schedule.
 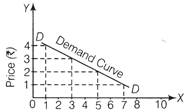 Quantity (units) Diagram Showing Mohan?s Demand Curve
 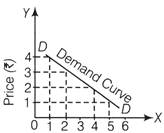 Quantity (units) Diagram Showing Sohan's Demand Curve
 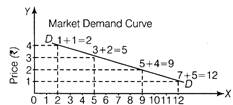 Quantity (units) Diagram Showing Market Demand Curve


You need to login to perform this action.
You will be redirected in
3 sec

