Answer:
A consumer strikes his equilibrium when, \[\frac{M{{U}_{X}}}{{{P}_{X}}}=\frac{M{{U}_{y}}}{{{P}_{y}}}\] Now, as per the given information,\[\frac{M{{U}_{X}}}{{{P}_{X}}}=\frac{6}{16}=\frac{3}{8}and\frac{M{{U}_{y}}}{{{P}_{y}}}=\frac{4}{24}=\frac{1}{6}\] \[\frac{M{{U}_{X}}}{{{P}_{X}}}>\frac{M{{U}_{y}}}{{{P}_{y}}}\] So, Vishnu is not in equilibrium. Now,\[\frac{M{{U}_{X}}}{{{P}_{X}}}>\frac{M{{U}_{y}}}{{{P}_{y}}}[\therefore \frac{3}{6}>\frac{1}{6}]\] Therefore, to attain equilibrium, Vishnu should start consuming more of Good X and less of Good Y so that MU of good X declines and MU of Good Y increases till the point, Where\[\frac{M{{U}_{X}}}{{{P}_{X}}}=\frac{M{{U}_{y}}}{{{P}_{y}}}\] Or Difference between individual demand curve and market demand curve are:
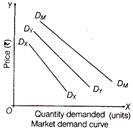
Basis Individual Demand Curve Market Demand Curve Meaning It is a graphical representation of an individual demand schedule, depicting an inverse relation between price and quantity demanded by an individual. It is a graphical representation of market demand schedule, depicting an inverse relation between price and quantity demanded by all the consumer in the market. Slope of the Curve The demand curve is steeper. The demand curve is flatter. Graphical Representation 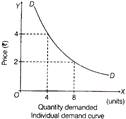


You need to login to perform this action.
You will be redirected in
3 sec

