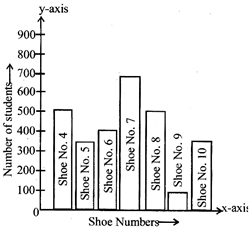
A) The bar graph represents the number of students wearing shoes of different numbers out of a total of 700 students.
B) It shows that the shoe number 7 is worn by the minimum number of students.
C) It represents the shoe number 9 is worn by the maximum number of students.
D) The bar graph represents the number of students wearing shoes of different numbers out of a total of 2900 selected students.
Correct Answer: A
Solution :


You need to login to perform this action.
You will be redirected in
3 sec

