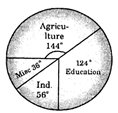
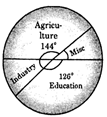
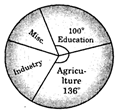
| Agriculture | 40% |
| Education | 35% |
| Industry | 15% |
| Misc. | 10% |
A)

B)
C)
D)
Correct Answer: C
Solution :
For pie diagram, find the sectorial angle in each case as follows:| Angle | ||
| Agriculture | 40% | \[\frac{(360\times 40)}{100}={{144}^{o}}\] |
| Education | 25% | \[\frac{(360\times 35)}{100}={{126}^{o}}\] |
| Industry | 15% | \[\frac{360\times 15}{100}={{54}^{o}}\] |
| Miscellaneous | 10% | \[\frac{360\times 10}{100}={{36}^{o}}\] |


You need to login to perform this action.
You will be redirected in
3 sec

