| Year | primary | secondary | tertiary |
| 1950 | 80,000 | 12,000 | 39,000 |
| 2000 | 3,14,000 | 2,80,000 | 5,55,000 |
| (i) Calculate the share of the three sectors in GDP for 1950 and 2000. |
| (ii) Show the data as a bar diagram similar to Graph 2 in the chapter. |
| (iii) What conclusions can we draw from the bar graph? |
Answer:
(i) (a)
![]()
Total GDP of three sectors = (80,000+19,000+39,000) = Rs. 1,38,000 crores
Share of primary sector
![]()
Share of secondary sector
![]()
Share of tertiary sector
![]()
(b)
![]()
Total GDP of three sectors = Rs. 11,49,000 crores
Share of primary sector
![]()
Share of secondary sector
![]()
Share of tertiary sector
![]()
(ii) Above data as a bar diagram:
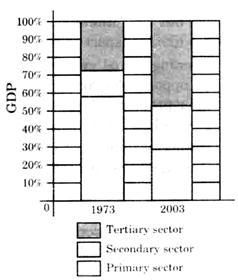
(iii) Conclusions drawn from the bar diagram-(Comparing 1950 and 2000)
(a) Share of primary sector in GDP has decreased.
(b) Share of secondary sector in GDP has increased.
(c) Share of tertiary sector in GDP has increased.
This shows that the economy is moving on the path of development as share of secondary and tertiary sector in GDP has increased in 2000 as compared to 1950.


You need to login to perform this action.
You will be redirected in
3 sec

