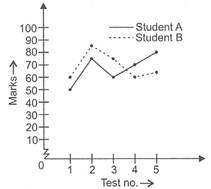
| DIRECTION: The line graph shows the performance of two students during a year. Read the graph and answer the following questions. |
 |
A) Test 5
B) Test 3
C) Test 2
D) Test 1
Correct Answer: D
Solution :
In both the tests 1 and 4, student B's performance was worst.


You need to login to perform this action.
You will be redirected in
3 sec

