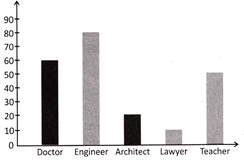
| Direction: The following bar graph shows the choice of future careers of students of a school. Use the bar graph to answer the questions given below: |
 |
A) 45
B) 50
C) 30
D) 80
E) None of these
Correct Answer: B


You need to login to perform this action.
You will be redirected in
3 sec

