| Study the following information carefully to answer the questions asked. | ||||||||||||||||||
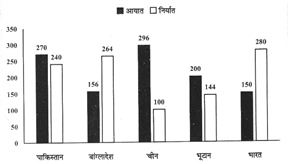
| The following bar graph represents the exports (in Cr Rs.) and imports (in Cr Rs.) of five countries in 2016. | ||||||||||||||||||
 | ||||||||||||||||||
|
A) \[32:17\]
B) \[32:19\]
C) \[35:23\]
D) \[19:17\]
E) None of these
Correct Answer: B


You need to login to perform this action.
You will be redirected in
3 sec

