| Study the following bar graph and answer the given questions. |
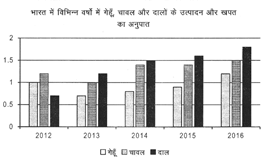 |
| If production of wheat and consumption of Rice in 2012 is 17.5 ton and 12.5 ton. Find the diiference between consumption of wheat and production office in same year. |
A) 2 ton
B) 3 ton
C) 3.5 ton
D) 2.5 ton
E) 1.5 ton
Correct Answer: D


You need to login to perform this action.
You will be redirected in
3 sec

