| Directions: Given line graph represents the number of people in a store since its opening till closing at various times of a day. |
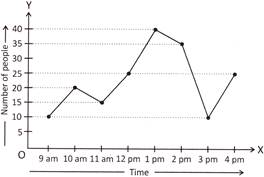 |
| Study the line graph and answer the questions given below: |
A) 12 pm
B) 1 pm
C) 2 pm
D) 10 am
E) None of these
Correct Answer: B
Solution :
Explanation: Option (b) is correct. The maximum number of people at the store were 40 at 1 pm. Therefore, the busiest time of the day at the store was 1 pm.


You need to login to perform this action.
You will be redirected in
3 sec

