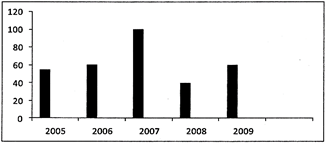
| Directions : The following bar graph shows the production of food grains in an Indian state during the five consecutive years. |
 |
A) 5 : 3
B) 5 : 2
C) 5 : 4
D) 5 : 7
Correct Answer: B
Solution :
(b): Max production (in 2007) =100 units Min production (in 2008) = 40 units \[\therefore Ratio=\frac{100}{40}=5:2.\]


You need to login to perform this action.
You will be redirected in
3 sec

