| Directions: Given bar graph represents the number of students of different classes of a school who participated in a competition. |
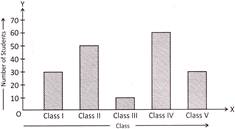 |
| Study the bar graph and answer the questions below: |
A) 190
B) 200
C) 220
D) 180
E) None of these
Correct Answer: D
Solution :
Explanation: Option (d) is correct. Total number of students who participated in the competition: \[=30+50+10+60+30=180\]


You need to login to perform this action.
You will be redirected in
3 sec

