| Year | Number of Computers sold |
| 1995 | \[\cancel{I\,I\,I\,I}\] \[\cancel{I\,I\,I\,I}\] \[\cancel{I\,I\,I\,I}\] \[I\,I\,I\] |
| 1996 | \[\cancel{I\,I\,I\,I}\] \[I\,I\,I\] |
| 1997 | \[\cancel{I\,I\,I\,I}\] \[\cancel{I\,I\,I\,I}\] |
| 1998 | \[\cancel{I\,I\,I\,I}\] \[I\] |
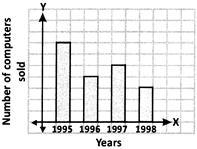 The bar for which year is incorrectly drawn?
A) 1995
B) 1996
C) 1997
D) 1998
Correct Answer: A
Solution :
From the given bar chart, it is clear that each square represents 2 units since the 6 computers sold in 1998 is represented by a bar extending 3 squares. So, the length (or height) of the bar for the year 1995 must be \[\frac{18}{2}=9\] squares. But the bar is drawn to a height of 7 squares.


You need to login to perform this action.
You will be redirected in
3 sec

