-
question_answer1)
From the frequency table, the percentage of families with less than 3 children is

| Number of children | 0 | 1 | 2 | 3 | 4 |
| Number of families | 2 | 5 | 11 | 15 | 7 |
Find the value of x.
A)
\[7\] done
clear
B)
\[15\] done
clear
C)
\[11\] done
clear
D)
\[18\] done
clear
View Solution play_arrow
-
question_answer2)
A survey was carried out for the purpose of determining the number of children in each family. The results are shown in the table.
| Number of children | 0 | 1 | 2 | 3 | 4 |
| Number of families | 1 | 4 | 7 | 6 | 2 |
Calculate the percentage of families which have more than 2 children.
A)
\[35%\] done
clear
B)
\[40%\] done
clear
C)
\[60%\] done
clear
D)
\[75%\] done
clear
View Solution play_arrow
-
question_answer3)
The scores obtained by a group of participants in a game are shown in the table. A participant who scores more than 3 points receives a hamper.
| Score | 2 | 3 | 4 | 5 |
| Number of participants | 104 | 16 | y | 34 |
If the number of participants who do not receive hampers is twice the number of those who do, find the value of y.
A)
\[2\] done
clear
B)
\[26\] done
clear
C)
\[32\] done
clear
D)
\[68\] done
clear
View Solution play_arrow
-
question_answer4)
The table shows the distribution of marks in an English test. Grade B is given to marks ranging from 40 to 54.
| Marks | Frequency |
| 30-34 | 2 |
| 35-39 | 8 |
| 40-44 | 13 |
| 45-49 | 8 |
| 50-54 | 5 |
| 55-59 | 4 |
Calculate the percentage of pupils who obtained grade B.
A)
\[26%\] done
clear
B)
\[52%\] done
clear
C)
\[65%\] done
clear
D)
\[75%\] done
clear
View Solution play_arrow
-
question_answer5)
The table shows the type and number of cakes sold by a bakery. In a pictograph, one symbol represents 5 cakes.
| Types of cakes | Number of cake |
| P | 50 |
| Q | 35 |
| R | 45 |
How many symbols are required to represent the number of the best-selling type of cake?
A)
\[5\] done
clear
B)
\[9\] done
clear
C)
\[10\] done
clear
D)
\[15\] done
clear
View Solution play_arrow
-
question_answer6)
A)
\[15\] done
clear
B)
\[300\] done
clear
C)
\[420\] done
clear
D)
\[420\] done
clear
View Solution play_arrow
-
question_answer7)
A)
\[10\] done
clear
B)
\[18\] done
clear
C)
\[60\] done
clear
D)
\[70\] done
clear
View Solution play_arrow
-
question_answer8)
The bar chart shows the number of cellphones sold by a shop on 5 days of a certain week. The difference between the highest number and the lowest number of cellphones sold is 15.
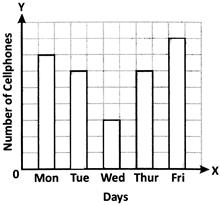
Find the number of cellphones sold on Thursday.
A)
\[6\] done
clear
B)
\[12\] done
clear
C)
\[18\] done
clear
D)
\[24\] done
clear
View Solution play_arrow
-
question_answer9)
Which of the following experiments has equally likely outcomes?
A)
Choose a number at random from 1 to 7. done
clear
B)
Toss a coin. done
clear
C)
Roll a die. done
clear
D)
All the above. done
clear
View Solution play_arrow
-
question_answer10)
The bar chart shows the number of television sets sold by a shop in 5 months.
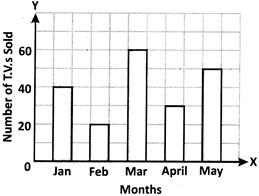
What is the sales in May as a percentage of the total sales in the 5 months?
A)
\[25%\] done
clear
B)
\[33\frac{1}{3}%\] done
clear
C)
\[50%\] done
clear
D)
\[66\frac{2}{3}%\] done
clear
View Solution play_arrow
-
question_answer11)
The table shows the frequency distribution of grades obtained by 120 students. The data is represented in the following pie chart.
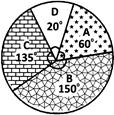
| Grade | A | B | C | D |
| Frequency | 20 | 50 | 45 | 5 |
Which sector is labelled incorrectly?
A)
A done
clear
B)
B done
clear
C)
C done
clear
D)
D done
clear
View Solution play_arrow
-
question_answer12)
Which of the following is an outcome?
A)
Rolling a pair of dice. done
clear
B)
A die landing on red. done
clear
C)
Choosing 2 marbles from ajar. done
clear
D)
Picking a card from a pack of 52 cards. done
clear
View Solution play_arrow
-
question_answer13)
The table shows the number of cups of ^^ four different beverages sold by a coffee shop on a certain day.
| Beverage | Number of cups |
| Coffee | 60 |
| Tea | 75 |
| Hot chocolate | 25 |
| Milk | 40 |
What is the angle of sector in a pie chart representing tea?
A)
\[{{40}^{o}}\] done
clear
B)
\[{{135}^{o}}\] done
clear
C)
\[{{108}^{o}}\] done
clear
D)
\[{{72}^{o}}\] done
clear
View Solution play_arrow
-
question_answer14)
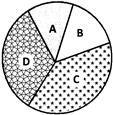
The pie chart shows the examination grades obtained by a group of students.
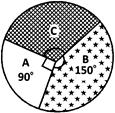
Which of the following statements about the pie chart is true?
A)
15% of the students scored grade B. done
clear
B)
90% of the students scored grade A. done
clear
C)
\[\frac{1}{3}\] of the students scored grade C. done
clear
D)
\[\frac{1}{4}\] of the students scored grade B. done
clear
View Solution play_arrow
-
question_answer15)
What is the probability of choosing a vowel from the alphabet?
A)
\[\frac{21}{26}\] done
clear
B)
\[\frac{5}{26}\] done
clear
C)
\[\frac{1}{21}\] done
clear
D)
\[\frac{5}{21}\] done
clear
View Solution play_arrow
-
question_answer16)
The pie chart shows the number of participants from four countries P, Q, R and S taking part in a tennis tournament.
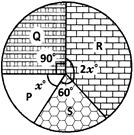
Given that there are 18 participants from country S, find the number of participants from country R.
A)
\[18\] done
clear
B)
\[21\] done
clear
C)
\[27\] done
clear
D)
\[42\] done
clear
View Solution play_arrow
-
question_answer17)
The table shows the number of three different brands of laptops sold by a certain store. The data is represented by the pie chart which shows a semicircle divided into six equal sectors.
| Brand | Number of laptops |
| Acer | 60 |
| Dell | 40 |
| Compaq | 20 |
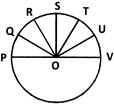
What is the angle of sector representing the number of Dell laptops sold?
A)
\[\angle POR\] done
clear
B)
\[\angle ROV\] done
clear
C)
\[\angle QOT\] done
clear
D)
\[\angle POU\] done
clear
View Solution play_arrow
-
question_answer18)
Direction: The histogram shows the number of members in the families of the pupils of Class VIII.
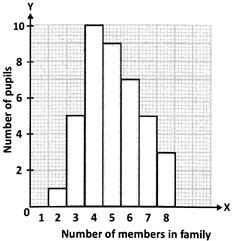
Study the histogram and answer the following questions. What is the enrolment of Class VIII?
A)
\[40\] done
clear
B)
\[50\] done
clear
C)
\[60\] done
clear
D)
\[70\] done
clear
View Solution play_arrow
-
question_answer19)
Direction: The histogram shows the number of members in the families of the pupils of Class VIII.
Study the histogram and answer the following questions. The maximum number of pupils have families with W members. What is the value of n?
A)
\[n=1\] done
clear
B)
\[n=4\] done
clear
C)
\[n=2\] done
clear
D)
\[n=3\] done
clear
View Solution play_arrow
-
question_answer20)
Direction: The histogram shows the number of members in the families of the pupils of Class VIII.
Study the histogram and answer the following questions. What is the total number of people in \[5-\]member families?
A)
\[22\] done
clear
B)
\[25\] done
clear
C)
\[45\] done
clear
D)
\[50\] done
clear
View Solution play_arrow
-
question_answer21)
Direction: The histogram shows the number of members in the families of the pupils of Class VIII.
Study the histogram and answer the following questions. What percentage of the pupils come from families with more than 5 members?
A)
\[20.5%\] done
clear
B)
\[21.5%\] done
clear
C)
\[50%\] done
clear
D)
\[37.5%\] done
clear
View Solution play_arrow
-
question_answer22)
What is the probability of getting an ace from a well shuffled deck of 52 playing cards?
A)
\[\frac{1}{13}\] done
clear
B)
\[\frac{2}{13}\] done
clear
C)
\[\frac{3}{13}\] done
clear
D)
\[\frac{4}{13}\] done
clear
View Solution play_arrow
-
question_answer23)
The pie chart shows the distribution of grades obtained by a group of students in a test. The number of students who scored grade C is twice the number who scored grade B, and \[\frac{3}{5}\] of the students scored grades B and C.
Find the angle of the sector which represents grade C.
A)
\[{{108}^{o}}\] done
clear
B)
\[{{144}^{o}}\] done
clear
C)
\[{{216}^{o}}\] done
clear
D)
\[{{288}^{o}}\] done
clear
View Solution play_arrow
-
question_answer24)
Which of the following is an experiment?
A)
Tossing a coin. done
clear
B)
Rolling a single 6-sided die. done
clear
C)
Choosing a marble from ajar. done
clear
D)
All of the above. done
clear
View Solution play_arrow
-
question_answer25)
A number from 1 to 11 is chosen at random. What is the probability of choosing an odd number?
A)
\[\frac{1}{11}\] done
clear
B)
\[\frac{5}{11}\] done
clear
C)
\[\frac{6}{11}\] done
clear
D)
\[\frac{3}{26}\] done
clear
View Solution play_arrow
-
question_answer26)
The following frequency table shows the number of occupants in each flat in an apartment.
| Number of occupants | Number of units (frequency) |
| 1 | 2 |
| 2 | 5 |
| 3 | 8 |
| 4 | 14 |
| 5 | 12 |
| 6 | 9 |
| 7 | 4 |
Find the percentage of the flats with fewer than 4 occupants.
A)
\[25%\] done
clear
B)
\[27.8%\] done
clear
C)
\[42%\] done
clear
D)
\[35%\] done
clear
View Solution play_arrow
-
question_answer27)
The table shows the grades obtained by a group of students in an examination.
| Grade | Number of students |
| A | 45 |
| B | 60 |
| C | 80 |
| D | 15 |
If the given information is illustrated using a pie chart, what is the angle of the sector that represents grade A?
A)
\[{{45}^{o}}\] done
clear
B)
\[{{81}^{o}}\] done
clear
C)
\[{{65}^{o}}\] done
clear
D)
\[{{100}^{o}}\] done
clear
View Solution play_arrow
-
question_answer28)
| Direction: Numbers 1 to 10 are written on ten separate slips (one number on one slip), kept in a box and mixed well. One slip is chosen from the box without looking into it. |
What is the probability of getting the number 6?
A)
\[\frac{1}{10}\] done
clear
B)
\[\frac{2}{20}\] done
clear
C)
\[\frac{1}{30}\] done
clear
D)
\[\frac{1}{15}\] done
clear
View Solution play_arrow
-
question_answer29)
| Direction: Numbers 1 to 10 are written on ten separate slips (one number on one slip), kept in a box and mixed well. One slip is chosen from the box without looking into it. |
What is the probability of getting a number less than 6?
A)
\[\frac{1}{3}\] done
clear
B)
\[\frac{1}{2}\] done
clear
C)
\[\frac{2}{3}\] done
clear
D)
\[\frac{4}{3}\] done
clear
View Solution play_arrow
-
question_answer30)
| Direction: Numbers 1 to 10 are written on ten separate slips (one number on one slip), kept in a box and mixed well. One slip is chosen from the box without looking into it. |
What is the probability of getting a number greater than 6?
A)
\[\frac{1}{5}\] done
clear
B)
\[\frac{3}{5}\] done
clear
C)
\[\frac{2}{5}\] done
clear
D)
\[\frac{4}{5}\] done
clear
View Solution play_arrow
-
question_answer31)
| Direction: Numbers 1 to 10 are written on ten separate slips (one number on one slip), kept in a box and mixed well. One slip is chosen from the box without looking into it. |
What is the probability of getting a 1-digit number?
A)
\[\frac{2}{10}\] done
clear
B)
\[\frac{3}{10}\] done
clear
C)
\[\frac{4}{10}\] done
clear
D)
\[\frac{9}{10}\] done
clear
View Solution play_arrow
-
question_answer32)
A school has a strength of 2000 students. The following pie chart shows the interests of students in different subjects.
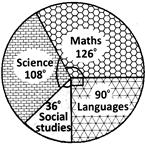
What is the number of students interested in Maths?
A)
\[700\] done
clear
B)
\[600\] done
clear
C)
\[200\] done
clear
D)
\[500\] done
clear
View Solution play_arrow
-
question_answer33)
Direction: The histogram shown gives the ages of 25 players of a sports club.

How many players are of age 35 years and above but less than 40 years?
A)
\[10\] done
clear
B)
\[6\] done
clear
C)
\[5\] done
clear
D)
\[3\] done
clear
View Solution play_arrow
-
question_answer34)
Direction: The histogram shown gives the ages of 25 players of a sports club.

How many players are aged below 30 years?
A)
\[10\] done
clear
B)
\[15\] done
clear
C)
\[9\] done
clear
D)
\[4\] done
clear
View Solution play_arrow
-
question_answer35)
Direction: The histogram shown gives the ages of 25 players of a sports club.
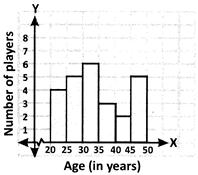
How many players are aged 40 years and above?
A)
\[8\] done
clear
B)
\[2\] done
clear
C)
\[10\] done
clear
D)
\[7\] done
clear
View Solution play_arrow
-
question_answer36)
The frequency table shows the number of passengers in each of the 40 taxis that were inspected during a police roadblock.
| Number of Passengers | 0 | 1 | 2 | 3 | 4 |
| Number of taxis | 3 | 8 | 10 | X | 7 |
Find the value of Y.
A)
\[2\] done
clear
B)
\[3\] done
clear
C)
\[12\] done
clear
D)
\[22\] done
clear
View Solution play_arrow
-
question_answer37)
The table shows the number of children in each of the 35 families surveyed.
| Number of Childers | Tally |
| 2 | \[|\,\,|\,\,|\,\,|\] |
| 3 | \[\cancel{I\,I\,I\,I}\] \[\cancel{I\,I\,I\,I}\] |
| 4 | \[\cancel{I\,I\,I\,I}\] \[|\,\,|\] |
| 5 | \[\cancel{I\,I\,I\,I}\] \[|\,\,|\,\,|\] |
| 6 | \[\cancel{I\,I\,I\,I}\] \[|\] |
Which of the following calculations used to find the percentage of families with more than 3 children, is correct?
A)
\[\frac{10}{35}\times 100%\] done
clear
B)
\[\frac{21}{35}\times 100%\] done
clear
C)
\[\frac{14}{35}\times 100%\] done
clear
D)
\[\frac{31}{35}\times 100%\] done
clear
View Solution play_arrow
-
question_answer38)
The bar chart represents the data in the frequency table given.
| Year | Number of Computers sold |
| 1995 | \[\cancel{I\,I\,I\,I}\] \[\cancel{I\,I\,I\,I}\] \[\cancel{I\,I\,I\,I}\] \[I\,I\,I\] |
| 1996 | \[\cancel{I\,I\,I\,I}\] \[I\,I\,I\] |
| 1997 | \[\cancel{I\,I\,I\,I}\] \[\cancel{I\,I\,I\,I}\] |
| 1998 | \[\cancel{I\,I\,I\,I}\] \[I\] |
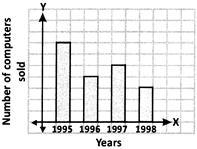
The bar for which year is incorrectly drawn?
A)
1995 done
clear
B)
1996 done
clear
C)
1997 done
clear
D)
1998 done
clear
View Solution play_arrow
-
question_answer39)
Direction: Study the histogram given and answer the questions that follow.
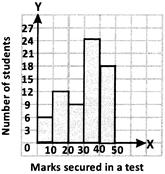
The pass mark in the test is 20. How many students failed in the test?
A)
\[6\] done
clear
B)
\[18\] done
clear
C)
\[12\] done
clear
D)
\[10\] done
clear
View Solution play_arrow
-
question_answer40)
Direction: Study the histogram given and answer the questions that follow.
How many students secured marks between 30 and 50?
A)
\[42\] done
clear
B)
\[24\] done
clear
C)
\[33\] done
clear
D)
\[18\] done
clear
View Solution play_arrow
-
question_answer41)
The pie chart shows the number of fruits sold in a store. The number of apples is 180 and the number of oranges is 400.
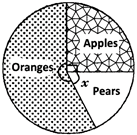
What is the angle of the sector representing the number of pears?
A)
\[{{60}^{o}}\] done
clear
B)
\[{{70}^{o}}\] done
clear
C)
\[{{160}^{o}}\] done
clear
D)
\[{{200}^{o}}\] done
clear
View Solution play_arrow
-
question_answer42)
The pie chart gives the expenditure (in percentage) on various items and savings of a family during a month.
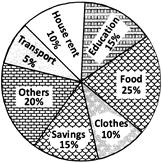
On which item was, the expenditure the maximum?
A)
Food done
clear
B)
Clothes done
clear
C)
Savings done
clear
D)
Transport done
clear
View Solution play_arrow
-
question_answer43)
The number of hours for which students of a particular class watched television during holidays is shown in the given graph.
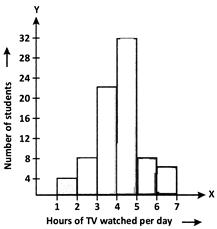
How many students spent more than 5 hours watching TV?
A)
\[14\] done
clear
B)
\[12\] done
clear
C)
\[08\] done
clear
D)
\[10\] done
clear
View Solution play_arrow
-
question_answer44)
Which of the following is an outcome?
A)
Rolling a pair of dice. done
clear
B)
A die landing on red. done
clear
C)
Choosing 2 marbles from ajar. done
clear
D)
Picking a card from a pack of 52 cards. done
clear
View Solution play_arrow
-
question_answer45)
Which of the following experiments has equally likely outcomes?
A)
Choose a number at random from 1 to 7. done
clear
B)
Toss a coin. done
clear
C)
Roll a die. done
clear
D)
All the above. done
clear
View Solution play_arrow
-
question_answer46)
What is the probability of choosing a vowel from the alphabet?
A)
\[\frac{21}{26}\] done
clear
B)
\[\frac{5}{26}\] done
clear
C)
\[\frac{1}{21}\] done
clear
D)
\[\frac{5}{21}\] done
clear
View Solution play_arrow