question_answer16) How many more pupils were present on Thursday than on Friday? 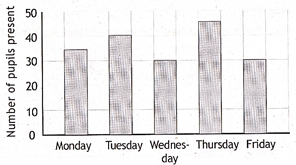
question_answer26) If each ![]() stands for
stands for ![]() and each
and each ![]() stands for 32, what does
stands for 32, what does ![]() stand for?
stand for?
 done
clear
done
clear
 done
clear
done
clear
 done
clear
done
clear
 done
clear
done
clear
question_answer38) If ![]() represents 12 men, how many men does
represents 12 men, how many men does ![]() represent?
represent?


You need to login to perform this action.
You will be redirected in
3 sec


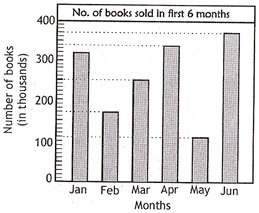 In which month is the number of books sold twice as many as those sold in February?
 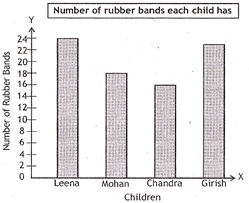 How many rubber bands must Leena give Mohan so that they have the same number of rubber bands?
  What is the amount collected over the five given years if the same fee of Rs. 30 per pupil is charged?
 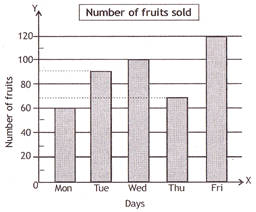 On which days did the grocer sell fewer than 100 fruits?
 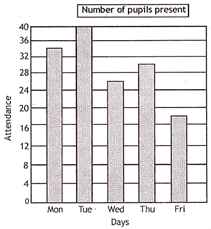 How many more pupils were present on Tuesday than on Monday?
 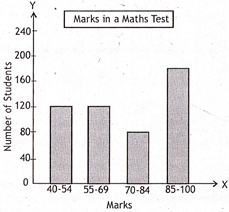 How many students scored more than 84 marks?
 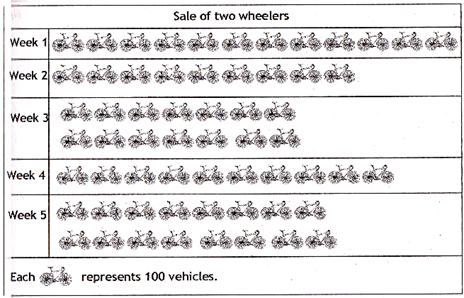 Between which two weeks is the increase in sale of two-wheelers the maximum?
 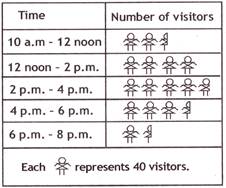 If the entrance ticket costs Rs. 25, how much was collected from the sale of tickets on that day?
 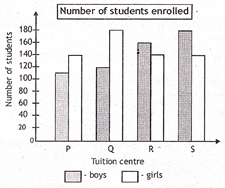 What would the total number of students enrolled at tuition centre P, if 46 more students want to enrol in it?
 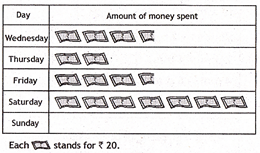 If Dinesh spent Rs.250 on Saturday and on Sunday, how many symbols must be drawn in the pictograph for Sunday?
 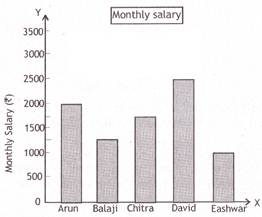 Each month, David spends half of his salary on food, clothes and conveyance. He gives Rs. 780 to his parents and saves the rest. What is David's savings in each month?
 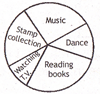 \[\frac{1}{3}\] of the students like music and dance. How many students like dance, if 14 of them like music?
 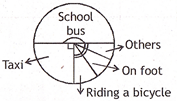 If the school has 1600 students, how many of them use modes of conveyance other than school bus and taxi?
 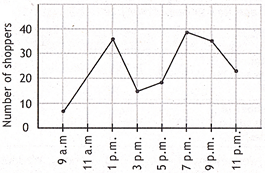 How many more people were at the shopping Centre at 7.00 p.m. than at 5.00 p.m.?
 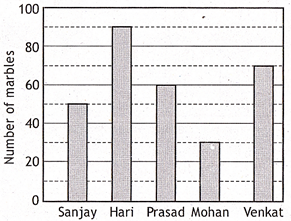 Prasad had twice as many marbles as which of the following?
 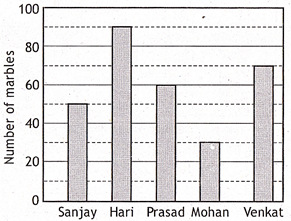 If each marble cost 9 paise, how much less did Sanjay spend than Hari?
 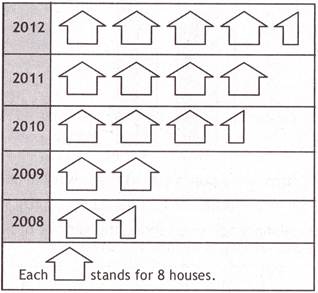 How many houses were built in 2008?
  How many more houses were built in 2012 than in 2009?
 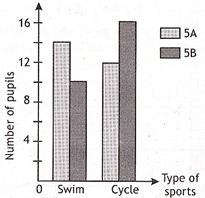 How many more pupils cycled than swam in 5B?
 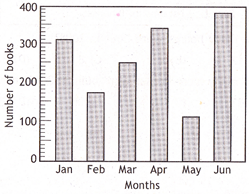 How many books were sold in total during the first four months?
  If the total sales is 1080 tins. Calculate the sale of the most popular brand.
  There are 23 girls in the class. If 8 boys were absent on Friday, how many boys were present on that day?
 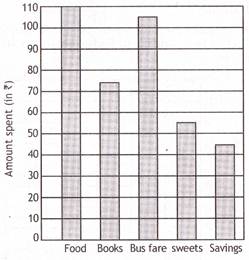 How much money did he spend altogether?
  If he had taken 7 trips by bus that day, what was his bus fare for each trip?
 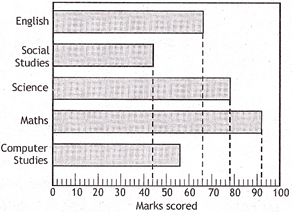 In which subject was Malathi's performance the best?
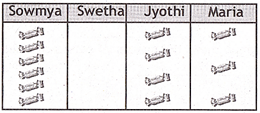
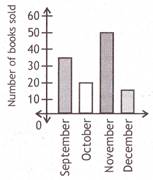 How many books did Jayaram sell in September and December?
 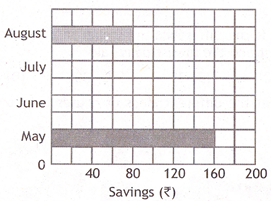 Dinesh saved a total of Rs. 780 during the four months. The amount of money saved in July was as much as that saved in June. How much did he save in June?
 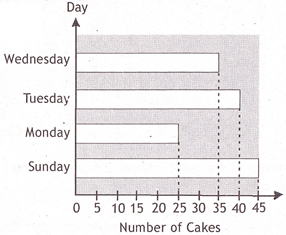 What is the difference in number of cakes between the highest and the lowest dally sale?
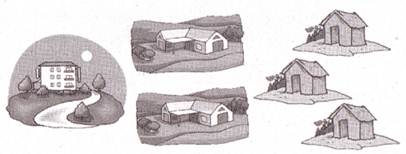
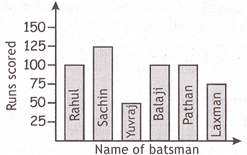 How many more runs did Rahul score than Laxman?
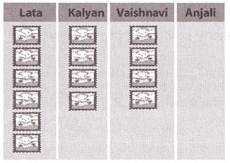
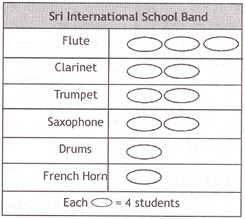 How many students play saxophone?
 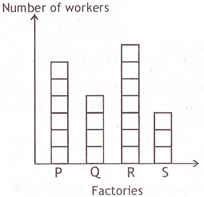 Find the total number of workers employed by the four factories.