0
question_answer1) DIRECTION: Sonam went to a bird sanctuary and saw the different types of birds. Given pictograph shows the number of birds she saw. Study the pictograph and answer the questions. Type of birds Number of birds Sonam saw Blue tit Blackbird Sparrow Starling Seagull Pigeon Each =5 birds How many sparrows did Sonam saw?
question_answer2) DIRECTION: Sonam went to a bird sanctuary and saw the different types of birds. Given pictograph shows the number of birds she saw. Study the pictograph and answer the questions. Type of birds Number of birds Sonam saw Blue tit Blackbird Sparrow Starling Seagull Pigeon Each =5 birds How many blue tits and pigeons were seen by Sonam?
question_answer3) DIRECTION: Sonam went to a bird sanctuary and saw the different types of birds. Given pictograph shows the number of birds she saw. Study the pictograph and answer the questions. Type of birds Number of birds Sonam saw Blue tit Blackbird Sparrow Starling Seagull Pigeon Each =5 birds How many more seagulls were seen by Sonam than the blackbirds?
question_answer4) DIRECTION: Sonam went to a bird sanctuary and saw the different types of birds. Given pictograph shows the number of birds she saw. Study the pictograph and answer the questions. Type of birds Number of birds Sonam saw Blue tit Blackbird Sparrow Starling Seagull Pigeon Each =5 birds How many starlings were seen by Sonam?
question_answer5) DIRECTION (5-7): The given pictograph shows the number of students who were absent in a day of a particular week. Study the pictograph and answer the following questions. Monday Tuesday Wednesday Thursday Friday Saturday Each means 2 students. On which day no student was absent?
question_answer6) On which day maximum number of students were absent and how many?
question_answer7) What is the total number of students who were absent in the week?
question_answer8) Five friends made a graph of the number of marks they got in mathematics. 
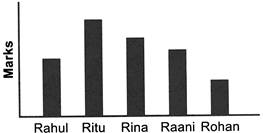
Arrange the marks of the students in ascending order?
question_answer9) DIRECTION: The given bar graph shows the time taken by 6 competitors to run a 200 m race. Study the given graph and answer the following questions. 
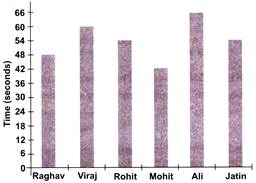
Who completed the race before Ali but after Jatin?
question_answer10) DIRECTION: The given bar graph shows the time taken by 6 competitors to run a 200 m race. Study the given graph and answer the following questions. Who took time more than 42 seconds but less than 50 seconds?
question_answer11) What is the difference between the maximum time and minimum time taken by runners to complete the race?
question_answer12) DIRECTION: The given bar graph shows the amount of money spent by Amit in a week. Study the graph and answer the questions. 
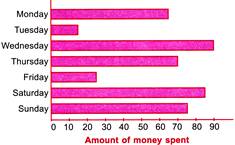
How much more amount Amit spent on Thursday than on Tuesday?
question_answer13) DIRECTION: The given bar graph shows the amount of money spent by Amit in a week. Study the graph and answer the questions. On which day Amit spent Rs. 65?
question_answer14) DIRECTION: The given bar graph shows the amount of money spent by Amit in a week. Study the graph and answer the questions. Find the amount of money spent by Amit on Sunday.
question_answer15) DIRECTION: The given bar graph shows the amount of money spent by Amit in a week. Study the graph and answer the questions. How much less Amount Amit spent on Friday than on Wednesday?
question_answer16) DIRECTION: The given graph shows the number of people who attended a book fair. Study it carefully and answer the following questions. The number of secondary school students was twice the number of________.
question_answer17) DIRECTION: The given graph shows the number of people who attended a book fair. Study it carefully and answer the following questions. How many less tertiary students attended book fair than primary school students?
question_answer18) DIRECTION: The given graph shows the number of people who attended a book fair. Study it carefully and answer the following questions. 
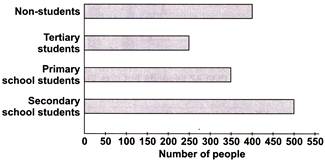
Number of secondary school students are ______ more than non-students.
question_answer19) DIRECTION: The given pictograph shows the number of 4 different kinds of plants Mohit bought. Study the pictograph and answer the questions. Kind of plants Number of plants bought Peppers Tomatoes Beans Carrots Each = 5 plants How many more tomato plants did he buy than pepper plants?
question_answer20) DIRECTION: The given pictograph shows the number of 4 different kinds of plants Mohit bought. Study the pictograph and answer the questions. Kind of plants Number of plants bought Peppers Tomatoes Beans Carrots Each = 5 plants How many bean plants did he buy?
question_answer21) DIRECTION: The given pictograph shows the number of 4 different kinds of plants Mohit bought. Study the pictograph and answer the questions. Kind of plants Number of plants bought Peppers Tomatoes Beans Carrots Each = 5 plants What is the total number of plants he buy?
question_answer22) DIRECTION: The given pictograph shows the number of children who came to story hour each week. Study the pictograph and answer the following questions. Story hour attendance Week Number of children 1 2 3 4 5 Each =4 children. How many children came to story hour in week 4?
question_answer23) DIRECTION: The given pictograph shows the number of children who came to story hour each week. Study the pictograph and answer the following questions. Story hour attendance Week Number of children 1 2 3 4 5 Each =4 children. How many more children came for story hour in week 3 than in week 2?
question_answer24) DIRECTION: The given pictograph shows the number of children who came to story hour each week. Study the pictograph and answer the following questions. Story hour attendance Week Number of children 1 2 3 4 5 Each =4 children. Total number of children came for story hours in all weeks is _______.
question_answer25) DIRECTION: The given pictograph shows the number of children who came to story hour each week. Study the pictograph and answer the following questions. Story hour attendance Week Number of children 1 2 3 4 5 Each =4 children. How many more children came to story hour in week 1 and week 5 together than in week 3?
question_answer26) Study the given table and answer the question based on the data in the table. Name of the child Things the child has Remarks Avlka Each figure represent 3 Aastha Each figure represent 2 Aanya Each figure represent 1 Bhoomi Each figure represent 2 Who had the maximum number of items?
question_answer27) Krishna counted the number of different types of cars parked in her colony. She made a graph from the data. Study the graph and answer the following question. 
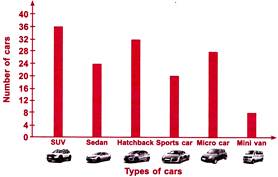
What is the difference between the maximum and minimum number of types of cars parked?
question_answer28) The given pictograph graph shows the number of bookmarks each student made. Study the pictograph and answer the following question. Students Number of bookmarks made Namita Vinod Rahul Sona Each represents 3 bookmarks How many less bookmarks did Namita make than Sona and Vinod together?
question_answer29) The given graph shows the number of books read by pupils in a class from July to December. Study the given graph and answer the following question. 
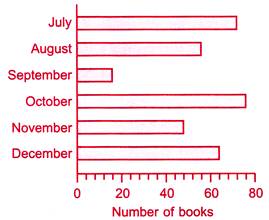
How many books were read altogether from July to November?
question_answer30) The given pictograph shows the number of sweaters ordered of different size. Study the pictograph and answer the following question. Sweaters ordered Size Number of sweaters ordered Small Medium Large Extra Large Each =5 sweaters. Which size of exactly 20 sweaters were ordered?
Please Wait you are being redirected....
You need to login to perform this action.You will be redirected in 3 sec
OTP has been sent to your mobile number and is valid for one hour
Your mobile number is verified.