Notes - Human Resources
Category : 8th Class
Human Resources
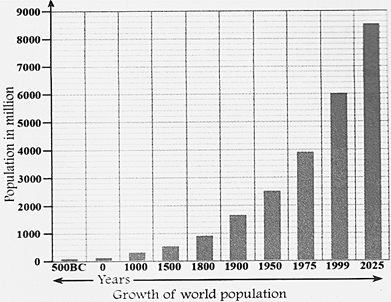
Population is dynamic. It keeps on changing with time. In about the mid-nineteenth century, the world population was 1 billion. Hundred years later, it increased to about 2 billion and then in 30 years to 3 billion. By the end of the 20th century, it had reached 6 billion! In less than 40 years, the population doubled! The population is now growing at the rate of 1.3 per cent per year so it has been estimated that by 2025, it will reach 8 billion. In this context, is the population of a country is its greatest resource? Let us try to answer this question in this chapter.
MAN AS A RESOURCE
Our earth has mineral and power resources. Humans make use of these resources and produce useful products. They can use these resources either judiciously which helps in growth and development of a country or indiscriminately which hampers the future growth path. The all-round development of a country depends upon the capacity and quality of the population which is called the human resource. The capacity of the human resources depends on? (i) literacy,(ii) employment according to their abilities,(iii) availability and provision of balanced and nutritious food, (iv) proper tools and machines (v) skilled hard-working labour.
POPULATION DISTRIBUTION
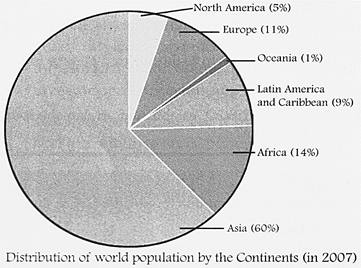
The way in which people are spread across the earth's surface is known as the pattern of population distribution. Look at the pie chart. Like other resources, human resources of the world are not evenly distributed. More than 90 per cent of the world's population is concentrated in about 10 per cent of the land. Almost three-quarter of the world's population lives in Asia and Africa.
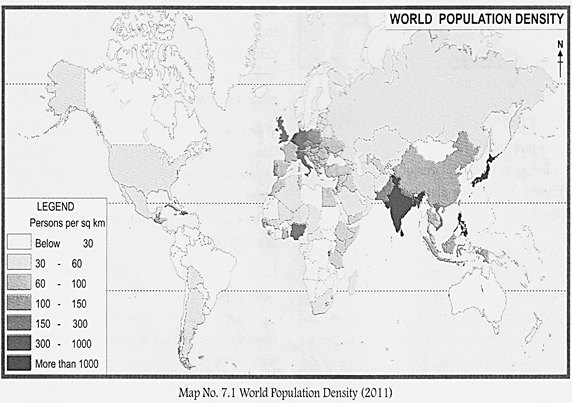
Population density is a measurement of average number of people living in an area. It is calculated by dividing the total number of people living in an area by the measure of the area of land. It is usually shown as the number of people per square kilometre. Some areas have high density of population whereas some are uninhabited or sparsely inhabited. The density of population has little to do with the development of a country. For example, both Bangladesh and Japan are densely populated however, Japan is economically more developed than Bangladesh. Accordingly, we can roughly divide the world into three regions: (i) Densely populated areas, (ii) Moderately populated areas and (iii) Sparsely populated areas.
Densely populated areas- Places which are densely populated have habitable environment and a large number of people living in the area. South and south-east Asia/ Europe and north- eastern North America are densely populated areas. South and south-east Asia have fertile river valleys and industrial regions due to which they are densely populated. Europe and north- eastern North America are densely populated due to easy availability of mineral resources, development of industries and suitable climate.
Moderately populated areas-Those regions which are agriculturally developed, have improved infrastructure and industries are moderately populated. Deccan Plateau of India, Central China, Central USA, deltas of river valleys. Tropical West Africa, Southern Russia and some parts of South America are moderately populated.
Sparsely populated areas-Places which are sparsely populated have few people. Sparsely populated places tend to be difficult places to live in like-Polar Regions, tropical deserts, high mountains and areas of equatorial forests. Physical and climatic conditions are not favourable for human habitation here. Tundra region in the north, Sahara desert and forested areas of the Amazon are some of the examples.
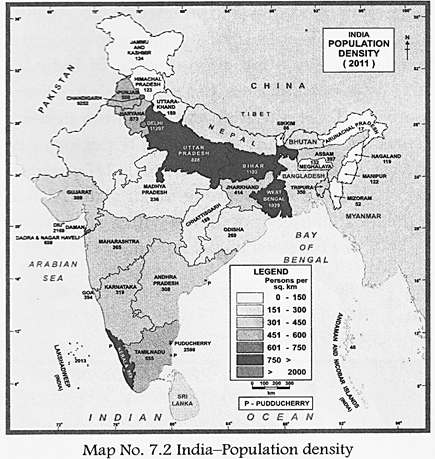
On an average, world population density is 45 persons per square kilometre (if we assume that the people are spread evenly over the entire land area). The population density of India in 2011 was 382 persons per sq. km. However, there is a large variation in population density across the country. It varies from 17 persons per sq. km in Arunachal Pradesh to 11297 persons per sq. km in Delhi. Among major states, Bihar is the most densely populated with a population density of 1102 persons per sq. km.
Q. Is there any correlation between areas of high population density and environmental health risks?
Geography Reveals
The first population census in British India was conducted in 1872. The census in India is carried out after every 10 years by the Office of the Registrar General and Census Commissioner under the Ministry of Home Affairs. It is one of the largest administrative tasks conducted by a federal government. The last population census was done in 2011. According to that census, during the decade of 2001-2011, India's annual population growth rate slowed down from 2.15 to 1.76.
Factors Affecting Distribution of Population
There are many reasons that people consider for living in certain places of the earth. Factors affecting human population distribution are as follows:
Physical features- Low lying flat areas like, plains along the river valleys are densely populated. They are more suitable for agriculture, development of industries and setting up infrastructure. The Ganga plains are the most densely populated areas of the world. In contrast, highlands are sparsely populated due to steep and rugged terrain. Thickly forested regions like the Amazon Basin, deserts and the Arctic are also sparsely populated.
Climate? Places with extreme climates such as cold polar areas of Arctic and Antarctica have hardly any population. Deserts which are very hot in the day time and cold at night are sparsely populated. Regions with moderate climate and abundant rainfall are densely populated.
Soil? fertile soils along the river valleys are suitable for agriculture. Ganga and Brahmaputra in India, Hwang-Ho and Chang Jiang in China and the Nile in Egypt are densely populated due to their fertile soil. The development of ancient civilisations also occurred along the river valleys due to fertile soils.
Natural resources?Areas with mineral deposits attract mining companies and a large number of people. Deposits of tin in the west coast of peninsular Malaysia, diamond mines in South Africa and discovery of oil in the Middle-East led to settling of people in these areas.
Accessibility? Places having developed transport and communication network have dense population as these places attract industry and trade. People prefer to settle where roads, rail lines, metro and port facilities are available.
Water availability?Water is required for domestic purposes, transport, agriculture, etc. People tend to live in the areas where fresh water is easily available. As a result, the river valleys are densely populated while deserts are sparsely populated.
Social factors-Urban areas are far more densely populated as they provide better living conditions than the rural areas. Employment opportunities are also more in urban areas. Areas with better infrastructure, housing, educational and health facilities, have dense population.
Cultural factors? Places which are culturally and religiously significant such as Mecca and Medina, Jerusalem and Varanasi; attract people.
Economic factors?Industrial areas and agriculturally rich areas provide employment opportunities and support a large population. The Osaka-Kobe industrial region of Japan is densely populated.
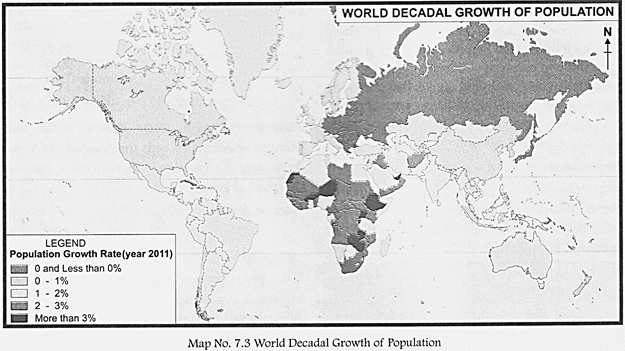
POPULATION GROWTH
Population growth reflects the number of births and deaths during that period and the number of people migrating to and from a country.
Population growth is actually the increase in a country's population during a period of time, usually one year.
At present, the countries of Africa, Asia and South America are experiencing a higher rate of population growth as compared to countries of Europe, North America and Australia. Population of India, as per census of 2011, has crossed 1.21 billion mark. With this, India has become the second most populous country in the world, while China is at the top with over 1.35 billion people. Although India occupies only 2.4°o of the world's land area, it supports almost 17.31°o of the world's population, which means one out of six people on this planet live in India. This makes India the most densely populated country in the world.
Birth Rate
Birth rate (BR) refers to the number of live births per thousand of a population in a year. Birth rate can be classified as follows:
|
Live births per 1,000 population |
Description of birth rate |
|
< 20 |
Low |
|
20-30 |
Medium |
|
>30 |
High |
Birth rates are high in India, China and Bangladesh because.
? Children are considered as resources. More children mean more number of helping hands for work e.g, on family subsistence farms.
? Development in healthcare facilities with increased access to immunisation, and disease eradication programmes.
? People are uneducated and unaware. They have little knowledge of family planning methods.
Birth rates are low in Sweden, Germany, Australia and UK because of:
? Increased access to family planning methods which help to control the number and gap between children.
? High costs of living make the schooling and bearing of the children expensive.
? Career-oriented educated women prefer having fewer, healthier children.
Death Rate
Death rate (DR) refers to the number of deaths per thousand of a population in a year. The table below describes the death rate (DR) per thousand Population.
|
Deaths Per 1,000 Population |
Description of death rate |
|
<10 |
Very Low |
|
10-15 |
Low |
|
>15-20 |
High |
|
>20 |
Very high |
Death rates are low in more economically developed countries and are falling in less economically developed countries because of:
? Better health care and medical facilities
? Rapid cures for many diseases such as-cancer, malaria, cholera, etc.
? Awareness about hygiene
? Clean water supplies and sanitation facilities
? Decline in infant mortality rate
Infant Mortality Rate (IMR) refers to the number of infants who die before reaching one year of age per thousand live births per year.
Natural Increase (N1) or Natural Decrease (ND)
To determine whether the population of any country is increasing or decreasing, the natural change has to be calculated.
Natural Increase (N1) occurs when the number of births exceeds the number of deaths. For example, in an year if birth rate is 25 per 1000, and death rate is 15 per 1000, there will be a natural increase of 10 per 1000.
Natural increase (N1)
= Birth rate (BR) - Death rate (DR)
= 25 per 1000 -15 per 1000 = 10 per 1000
Natural Decrease (ND) occurs when the number of deaths exceeds the number of births. For example, Sweden experienced a natural decrease of 1 per 1000 in year 2000.
Natural decrease (ND)
= Death rate (DR) - Birth rate (BR)
= 11 per 1000 - 10 per 1000 = 1 per 1000
Migration
Migration of people from one country to another country also influences the population growth rate. Migration is a worldwide phenomenon. People migrate in search of better jobs, health facilities, living conditions, etc. A migrant is a person who moves to live in another place either permanently or temporarily. There are basically two type of migration: (i) Forced migration and (ii) voluntary migration.
Forced migration? the fall of Vietnam to the communists in 1975 forced more than a million people to migrate to Singapore, Malaysia and Hong Kong. Sometime natural calamities also force people to migrate.
Voluntary migration? between 1955 and 1965, many migrants from India and Pakistan moved to England, as many semi-skilled jobs were available there. Even today, people move to better places in searches of better life style and working conditions.
Geography Reveals
Migration is of two types in terms of origin and destination. When a person leaves his native country and moves out to a new destination, he becomes an 'emigrant' in his native country and an 'immigrant' in the new country.
Immigration is the movement of non-native to a country in order to settle there. Immigrants are the people who enter the country.
Emmigration is when people move out of a country to take up permanent residence elsewhere. Emigrants are the people who leave the country.
Net migration = Immigration ? Emmigration
Population growth is the result of natural increase and net migration in the population.
Population growth
= Natural increase + Net migration
POPULATION COMPOSITION
Population composition refers to the demographic structure of population within a geographic area. By determining the population composition, we come to know about the number of males or females in that population, their age group, their educational level, their occupations, their income and health conditions. Some of the components of population composition are-literacy life expectancy, dependency ratio and age-sex ratio.
Literacy
Literacy is the ability to read and write with understanding. It is the key for socio-economic progress. Indian literacy rate grew to 74.04% in 2011 from 12% at the end of British rule in 1947. The 2011 census, however, indicated the 2001- 2011 decadal literacy growth of 9.2%, which is slower than the growth seen during the previous decade. There is a wide gender disparity in the literacy rate in India: effective literacy rates (age 7 and above) in 2011 were 82.14% for men and 65.46°c for women.
Life Expectancy
Life expectancy is defined as the number of years a person is expected to live from the time she or he is born. Many reasons can be attributed to high or low life expectancy, which is a measure rate of the morality of the population.
Since 1950s, life expectancy has been increasing in both developing and developed countries. By 2000, the average life expectancy for about 70% of the world population had risen to 65 years?63 years for males and 68 years for females. For the other 30% of the world's population living in very poor economically under developed countries, life expectancy is below 60 years. In countries like Japan and USA, the life expectancy is more than 75 years. In 2011 life expectancy in India was 66 years.
Dependency Ratio
This is the ratio of the number of people to number of economically active people in the country.
Dependency ratio =
\[\frac{Number\text{ }of\text{ }economically\text{ }non-active\text{ }people}{Number\text{ }of\text{ }economically\text{ }active\text{ }people}\]
Economically non-active people are the young and elderly. The young belongs to 0-14 age group while the elderly are above 65 years of age. The economically active people are in the 15-65 age group. A dependency ratio of 1:3 implies that one economically non-active person is supported by three economically active persons.
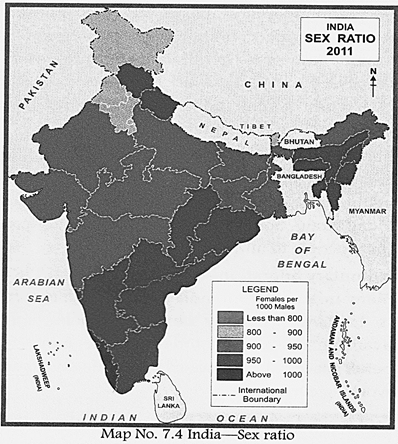
The Age-Sex Ratio-The Population Pyramid The classification of a population into different age groups is called the age structure. It indicates the percentage of productive population. Sex ratio is the ratio of females to males in a population. It is denned as the number of females per thousand males. Overall sex ratio in India is 940 females per 1000 males today. In 2001, it was 933 females per 1000 males.
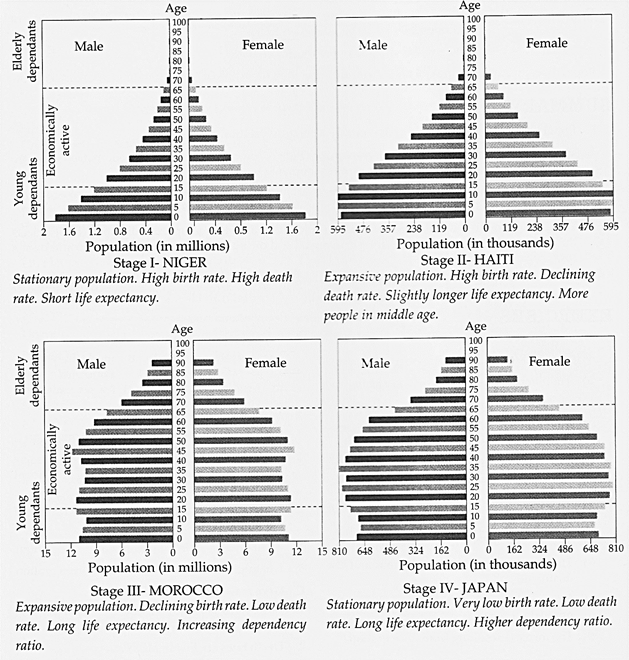
The age-sex structure of a country's population can be graphically represented by a population pyramid which shows the proportion of females and males in different age groups. Usually measured in percentages or numbers of the total population, each point on the vertical axis marks a range of 5 years while each point on the horizontal axis marks a percentage or number of the total population. The right side of the pyramid shows the percentage or number of females and the left side shows the percentage or number of males in the population. Remember the shape of the pyramid is determined by birth rate, death rate and migration. The shape of a population pyramid can tell us a lot about an area's population:
? It gives us information about birth rate and death rate as well as life expectancy.
? It tells us how many dependents are there. Young and elderly both.
The dependents rely upon the economically active people for economic support. A number of more economically developed countries (MEDCs) have a growing number of elderly dependents while many less economically developed countries (LEDCs) have a high number of young dependents.
Population pyramids of under developed countries like-Niger have a wider base and a narrow top. It represents a high birth rate and high death rate. This is because although many children are born, a large percentage of them die in their infancy. As a result, relatively few become adults and there are very few old people. This is first stage of population growth where population is stationary.
In countries where economic development takes off like-Haiti; death rate is decreasing and the pyramid is broad in the younger age groups, because now more infants survive to become adults. In such countries birth rates remain high but death rates fall rapidly. This is second stage of population growth where population expands. Countries that are ahead in the category of economically developed countries like- Morocco, have falling birth rates and even lower death rates. At this stage; medical facilities, living standards, diet, education and social care increases. Brazil and India have how entered into this category. This is third stage of population. Countries like?Japan and Australia fall in fourth stage with low birth rates. The pyramid is narrow at the base and broad at the top. Decreased and low death rate allows large number of people to reach old age. It has maximum working population but population is again stationary; but with very low birth and death rates.


You need to login to perform this action.
You will be redirected in
3 sec

