Data Handling
Category : 7th Class
Data Handling
Modern society is information oriented. Every person wants numeric information of different fields of the society like the marks obtained in a particular subject by the students, five year plans etc. Statistics is a branch of mathematics which deals with the process, analyzing and interpreting the data.
Terms Related to Data
The runs scored by 11 members of a cricket team are as follows.
34, 0, 25, 34, 67, 73, 67, 1, 0, 34, 71.
Arrange the above data using tally marks.
|
Scores |
Tally Mark |
Frequency |
|
0 |
II |
2 |
|
1 |
I |
1 |
|
25 |
I |
1 |
|
34 |
III |
3 |
|
67 |
II |
2 |
|
71 |
I |
1 |
|
73 |
I |
1 |
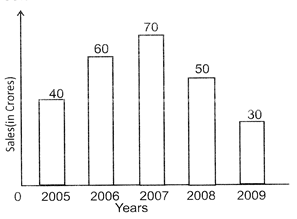
The total sales of a company (in crores) in different years are as follows.
|
Years |
2005 |
2006 |
2007 |
2008 |
2009 |
|
Sales (in Crores) |
40 |
60 |
70 |
50 |
30 |
Present the above data in the form of a bar graph.
Solution:
Mean
Mean is defined as the ratio of sum of observation to total number of observations.
\[\,Mean=\frac{Sum\,of\,observations}{total\,\,number\,of\,observations}\]
Median
Median of a data refers to the value which lies in the middle of the data with half of the observations above it and the other half below it.
To find the median of a set of observations, we use following steps:
Step 1: Arrange the given data either in ascending or descending order
Step 2: Count the number of observations.
Step 3: If the number of observations is odd, then \[median={{\left( \frac{n+1}{2} \right)}^{th}}\,\,observation\]
Step 4: If the number of observations is even, then \[median=\frac{{{\left( \frac{n}{2} \right)}^{th}}observation\,\,+\,{{\left( \frac{n+1}{2} \right)}^{th}}\,observation}{2}\]
Mode
Mode of a set of observations is the observation that occurs most often.
Find the mean of first five even natural numbers.
Solution:
First five even natural numbers are 2, 4, 6, 8, 10
From the above formula, we get
\[Mean=\,\,\,\frac{2+4+6+8+10}{5}\,\,=\,\,\,\frac{30}{5}\,\,=\,\,\,6\]


You need to login to perform this action.
You will be redirected in
3 sec

