Logical Venn Diagram
Category : 5th Class
Logical Venn Diagram
Objectives
· Students will be able to find out the relation between some items of a group by diagrams.
· They will be able to compare and contrast groups of things.
Introduction
A Venn Diagram is a visual brainstorming tool used to compare and contrast two (sometimes three) different things. Comparing is looking at traits that things have in common, while contrasting is looking at how they differ from each other.
A Venn Diagram is made up of two large circles that intersect with each other to form a space in the middle. Each circle represents something that you want to compare and contrast. Where the two circles intersect, you would write traits that the two things have in common. In either side of the intersecting space, you would write the differences among the two things.
Type-I: Different Types of Questions Based on Venn Diagrams
CASE 1:
When one group of items is completely included in the second group of items and the second, again completely belongs to the third group, they are represented as shown.
Example 1:
Seconds, Minutes, Hours
Explanation: Venn diagram would be as follows:
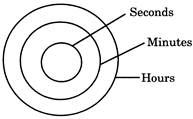
Clearly, seconds are a part of minutes and minutes are a part of hours.
CASE 2:
If the items evidently belong to three different groups, i.e., they are not correlated with each other in any way. They are represented as shown.
Example 2:
Whale, Crocodile, Bird
Explanation:
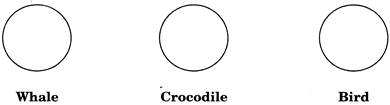
They all belong to different categories.
CASE 3:
If the three items are partly related to each other, they are represented as shown.
Example 3:
Human, Carnivorous, Animal
Explanation: Venn diagram would be as given.
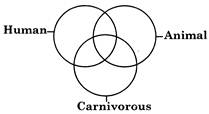
Clearly, all three are related to each other.
Case 4:
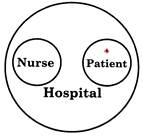
If two separate groups of items are completely unrelated to each other, but they are completely included in the third group, then the relationships can be diagrammatically shown as:
Example 4
Hospital, Nurse, Patient
Explanation:
Nurse and Patient are entirely different. But both are parts of Hospital.
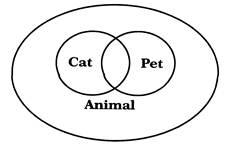
Case 5:
When two groups of items have some common relationship and both of them are completely included in the third group, the relationship is shown by two smaller intersecting circles in a third large circle.
Example 5
Animal, Cat, Pet
Explanation:
Some Cats are Pets and some pets are cats but all Cats and Pets are Animals.
Case 6:
If one item belongs to the class of second while, third item is entirely different from the two and they may be represented by the following diagram.
Example 6:
Engineers, Human Being, Rats
Explanation: Venn diagram is as follows:
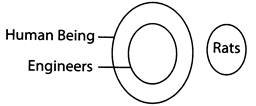
As we know that, all engineers are human beings but rats are entirely different to both of these.
Case 7:
If one group of items is partly included in the second group of items and the third group is completely unrelated to these two groups, their relationship is diagrammatically shown as:
Example 7:
Wire, Copper, Rubber
Explanation:
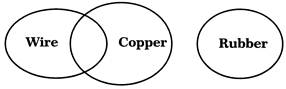
Some Wires are made of Copper but Rubber is entirely different.
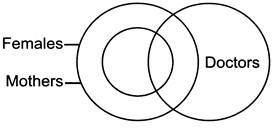
Case 8:
If one item belongs to the class of second and the third item is partly related to these two, they are represented as shown:
Example 8:
Females, Mothers, Doctors
Explanation: Venn diagram is as follows:
Case 9:
If one item belongs to the class of second and the third item is partly related to the second, they are represented as shown.
Example 9:
Females, Mothers, Children
Explanation:
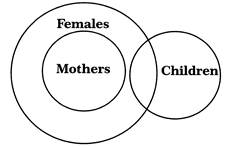
All Mothers are Females. This would be represented by two concentric circles but some females are Children but Children cannot be Mothers.
Type-II: Venn Diagrams formed by using different Geometrical Figures
We have used only circles to represent different relationships. Here, we will use different figures to show different relationships.
Example 10:
Which of the regions marked 1-7 represent the urban educated who are not hard working?
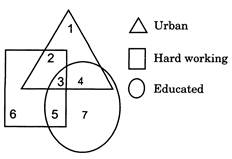
(a) 2 (b) 1
(c) 4 (d) 5
Ans: (c)
Explanation: The region which represents the urban educated who are not hard working lies outside the square but common to triangle and circle i.e. '4'.
Direction (Examples 11 and 12): Study the diagram given below and answer each ofthe following questions.
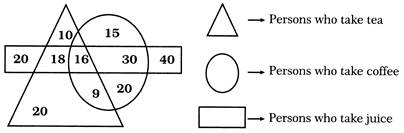
Example 11:
How many persons who take both tea and juice but not coffee?
(a) 20 (b) 18
(c) 25 (d) 15
Ans: (b)
Explanation: 18 persons take both tea and juice but not coffee.
Example 12:
How many persons are there who take both tea and coffee but not juice?
(a) 22 (b) 17
(c) 9 (d) 20
Ans: (c)
Explanation: Number of persons who take both tea and coffee but not juice is 9.


You need to login to perform this action.
You will be redirected in
3 sec

