Data Handling
Category : 5th Class
DATA HANDLING
FUNDAMENTALS
Data handling can be done in different ways and one such way is representation of raw data in pictorial form. Such as bar diagram, histogram, pie-chart and line graph.
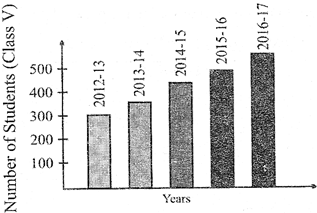
Bar diagram
Bar diagrams is one of the simplest and most common graph used to represent data. In bar diagram usually bars of uniform width are drawn with equal spacing between them on one axis (x-axis) depicting the variables. The value of the variables is shown on the other axis (y-axis) and the height of the bars depends on the value of the variables.
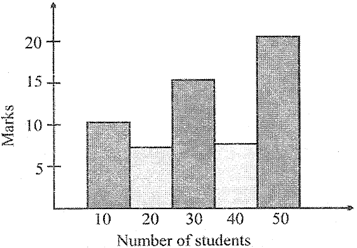
This is a form of representation like the bar graph out is used tor continuous class interval. It consists of continuous bars drawn adjacent to each other.
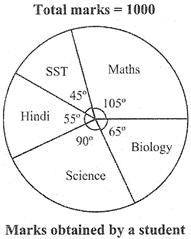
Pie Chart: A pie-chart is a pictorial representation of the numerical data by sectors of the circle. The area of each sector is proportional to the magnitude of the data represented by the sector.
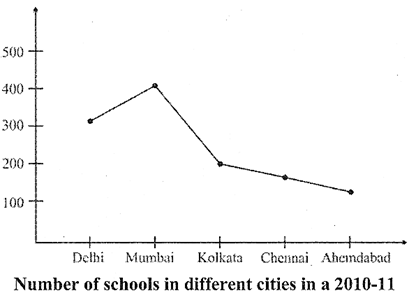
Line Graph: Line graph is another method of representation of the numerical data. In line graph the collected data are represented by specific points joined together by straight lines. The points are plotted on two dimensional plane one on the horizontal axis and the other on the vertical axis.


You need to login to perform this action.
You will be redirected in
3 sec

