Data Handling
Category : 2nd Class
LEARNING OBJECTIVES
This lesson will help you to lean
QUICK CONCEPT REVIEW
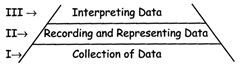
The information in a list can be in the form of names and numbers. Such information is called data. There are three steps of data handling -
STEPS OF DATA HANDLING
Data collection process includes:
Example:
I want to know the favourite sport of class II. How can I do that?
To know the favourite sport of class II we need to:
Hockey/Cricket/Tennis/Football
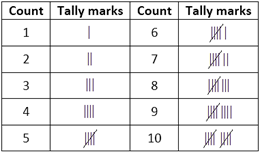
Data are facts that are collected by counting things and events. The data can be represented through tally marks.
Tally marks are vertical lines. They can be counted in group of 5. One vertical line is drawn for each of the first four counts. The fifth is represented by a line across the previous four lines.
Representation of Tally Marks.
Amazing Facts
Example:
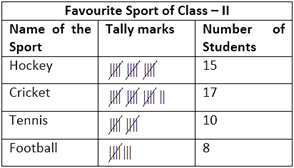
From above table it can be concluded:
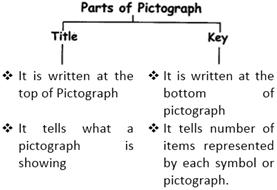
We can represent some numerical information (data) in the form of pictures, it is known as pictograph or pictorial representation.
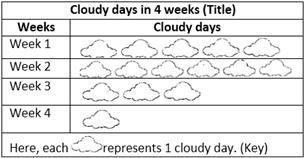
Example: Raj recorded number of cloudy days for 4 weeks in a month.
| Weeks | Week 1 | Week 2 | Week 3 | Week 4 |
| Cloudy days | 5 | 6 | 3 | 1 |
This information can be represented on the pictograph in following manner.
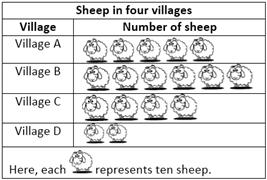
Scale: When objects are more in number, then one picture can represent more than one object. This is called scale. We can make a pic+ograph with different scales. Example: The number of sheep in four villages are given below
| Village | Village A | Village B | Village C | Village D |
| Sheep | 50 | 60 | 40 | 20 |
Historical Preview
While interpreting data, we draw conclusions from the data which help us to take decisions.
Example: The number of burgers sold at Tango's shop on Monday, Tuesday, Wednesday and Thursday is represented through the following pictograph.
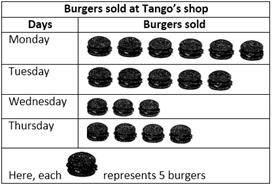
So if Tango uses this data properly he would prepare less burgers on Wednesday.
This would save his money. Don't you agree?
Real Life Examples


You need to login to perform this action.
You will be redirected in
3 sec

