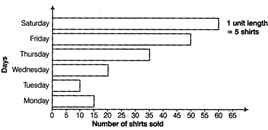
 Now, answer the following questions. (a) What information does the above bar graph give? (b) What is the scale chosen on the horizontal line representing number of shirts? (c) On which day were the maximum number of shirts sold? How many shirts were sold on that day? (d) On which day were the minimum number of shirts sold? (e) How many shirts were sold on Thursday?
Answer:
(a) Given bar graph shows the number of shirts sold from Monday to Saturday. (b) Scale on horizontal line is 1 unit = 5 shirts. (c) From given bar graph, it is clear that maximum number of shirts sold is shown by the largest bar (i.e. on Saturday). Hence, on Saturday 60 shirts were sold. (d) From given bar graph, it is clear that smallest bar shows the minimum number of sold shirts (i.e. on Tuesday.) Hence, the minimum number of shirts were sold on Tuesday. (e) From given bar graph, it is clear that on Thursday, 35 shirts were sold.


You need to login to perform this action.
You will be redirected in
3 sec

