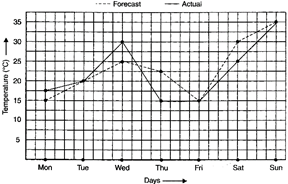
 (a) On which days was the forecast temperature the same as the actual temperature? (b) What was the maximum forecast temperature during the week? (c) What was the minimum actual temperature during the week? (d) On which day did the actual temperature differ the most from the forecast temperature?
Answer:
(a) The forecast temperature was the same as the actual temperature on Tuesday, Friday and Sunday. (b) The maximum forecast temperature during the week was \[{{35}^{o}}C\]. (c) The minimum actual temperature during the week was \[{{15}^{o}}C\]. (d) Day Difference in the actual temperature and the forecast temperature Mon \[{{17.5}^{o}}C-{{15}^{o}}C={{2.5}^{o}}C\] Tue \[{{20}^{o}}C-{{20}^{o}}C={{0}^{o}}C\] Wed \[{{30}^{o}}C-{{25}^{o}}C={{5}^{o}}C\] Thu \[{{22.5}^{o}}C-{{15}^{o}}C={{7.5}^{o}}C\] Fri \[{{15}^{o}}C-{{15}^{o}}C={{0}^{o}}C\] Sat \[{{30}^{o}}C-{{25}^{o}}C={{5}^{o}}C\] Sun \[{{35}^{\text{o}}}C-{{35}^{\text{o}}}C={{0}^{\text{o}}}C\] Therefore, the actual temperature differed the most from the forecast temperature on Thursday.


You need to login to perform this action.
You will be redirected in
3 sec

