 (d) In which year was there the greatest difference between the sales as compared to its previous year?
Answer:
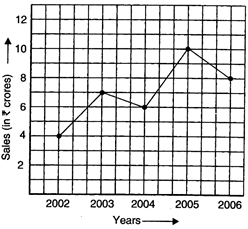
(a) The sales in (i) 2002 were Rs 4 crore and in (ii) 2006 were Rs 8 crore. (b) The sales in (i) 2003 were Rs 7 crore and in (ii) 2005 were Rs 10 crore. (c) The difference between the sales in 2002 and 2006 Rs 8 crore ? Rs 4 crore = Rs 4 crore (d) The difference between the sales in 2002 and 2003 = Rs 7 crore ? Rs 4 crore = Rs 3 crore The difference between the sales in 2003 and 2004 = Rs 7 crore ? Rs 6 crore = Rs 1 crore The difference between the sales in 2004 and 2005 = Rs 10 crore ? Rs 6 crore = Rs 4 crore The difference between the sales in 2005 and 2006 = Rs 10 crore ? Rs 8 crore = Rs 2 crore Therefore, in year 2005 the difference between the sales as compared to its previous year was the greatest.


You need to login to perform this action.
You will be redirected in
3 sec

